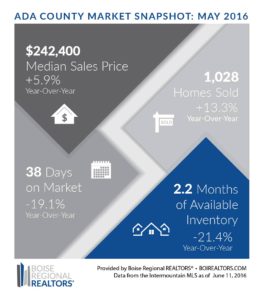
Ada County home prices are typically the highest in June, July, and August each year, based on monthly averages going back to 2004. Homes that sell in these months typically go under contract between April and July, as it takes on average 30-60 days from an accepted offer to get to the closing table. In May 2016, Days on Market was at 38 days — meaning most of those homes sold last month went under contract in March or April. Looking ahead, sellers still have time to get on the market and take advantage of some of the highest sale prices of the year.
While inventory of existing homes is still tight compared to last year (down 17.7% from May 2015), there has been some month-over-month improvement in the number of existing homes for sale, as more sellers hope to secure a summer closing.
- February to March 2016, existing inventory grew by 7.8%
- March to April 2016, existing inventory grew by 6.5%
- April to May 2016, existing inventory grew by 16.4%
Although we generally expect more homes to come on the market throughout spring, this year’s trend is the reverse of what we saw in 2015:
- February to March 2015, existing inventory grew by 14.2%
- March to April 2015, existing inventory grew by 8.6%
- April to May 2015, existing inventory grew by 4.2%
The 2016 numbers are encouraging, but more existing homes are needed to keep up with buyer demand — evidenced by a 12.8% increase in pending sales activity. The low inventory combined with higher pending sales resulted in a 22.7% year-over-year decrease in months supply of existing homes for sale, ending the month at just 1.7 months of inventory. (A balanced market is typically between 4-6 months of supply.)
Newly constructed inventory for Ada County did increase by 4.6% compared to May 2015, however, the higher median sales price for new homes (at $316,450 in May 2016) is out of reach for many first-time home buyers, and may be too much of a jump in price for move-up buyers — especially compared to the median sale price for existing homes, which was at $228,250 in May 2016. That said, demand for new homes remained strong as this segment saw a 46.4% year-over-year increase in pending sales, resulting in a 31.6% drop in months supply from May 2015, ending at 3.9 months of new inventory.
“While the spring and summer months are typically the most active for the Ada County real estate market, the past few years have seen sustained activity well into fall and winter,” said Carey Farmer, 2016 President of Boise Regional REALTORS® and Broker Associate with Group One Sotheby’s International Realty. “Anyone who is considering selling their home should speak to a REALTOR® to get the best advice on price and the home sale process, based on current market conditions.”
Additional information about trends within each county, and by price point, by existing vs. new construction, and by neighborhood, are now available in the May 2016 Market Report. This report includes an explanation of the metrics and notes on data sources and methodology.
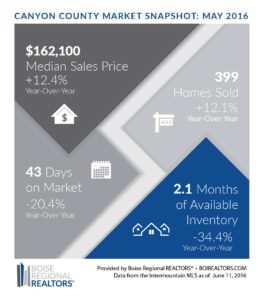
Download the market snapshot graphics for Ada County and Canyon County:
To learn more about how this housing market is having an impact on the region as a whole, and how the regional trends are affecting the market, join us for BRR’s Mid-Year Housing Summit on June 23. Details at boirealtors.com.
# # #
This report is provided by the Ada County Association of REALTORS®, which began doing business as Boise Regional REALTORS® (BRR) in 2016. BRR is the largest local REALTOR® association in Idaho, with over 3,700 members and two wholly-owned subsidiaries — the Intermountain Multiple Listing Service, Inc. (IMLS) and the REALTORS® Community Foundation. This report is based primarily on the public statistics provided by the IMLS, available at: intermountainmls.com/Statistics/Static.aspx. These statistics are based upon information secured by the agent from the owner or their representative. The accuracy of this information, while deemed reliable, has not been verified and is not guaranteed. These statistics are not intended to represent the total number of properties sold in the counties or cities during the specified time period. The IMLS and BRR provide these statistics for purposes of general market analysis but make no representations as to past or future performance. || The term “single-family homes” includes detached single-family homes with or without acreage, as classified in the IMLS. These numbers do not include activity for mobile homes, condominiums, townhomes, land, commercial, or multi-family properties (like apartment buildings). If you are a consumer, please contact a REALTOR® to get the most current and accurate information specific to your situation.
Distributed to the media on June 12, 2016.


