ADA COUNTY HOUSING MARKET SLOWS ITS PACE … EVER SO SLIGHTLY
Key Takeaways:
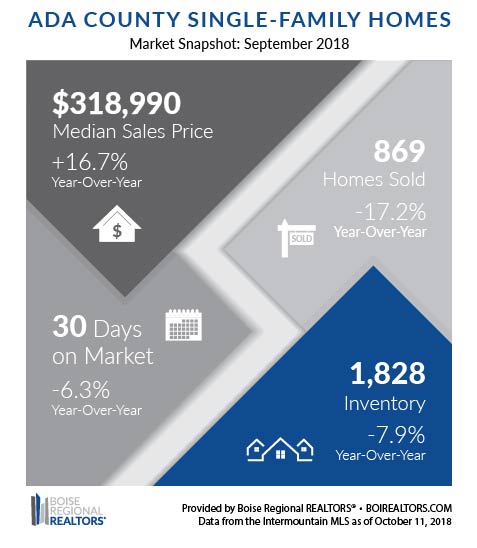
- Similar to nationwide trends in recent months, existing home sales in Ada County were down 24.0% compared to the same month last year – and down 25.2% from August 2018.
- The primary factor affecting sales is the lack of existing inventory. Existing inventory has been consistently down year-over-year for 48 months or four years. As of September 2018, inventory of existing homes in Ada County was down 19.2% compared the same month the previous year.
- Beyond inventory and sales counts, there are three other metrics we’re also watching closely to see which way the market may be moving: days on market, percent of original list price, and months supply of inventory.
- It’s a complex set of factors that will determine where the market goes in the next few months – and REALTORS® are the best-equipped partner to help sellers correctly price their homes based on real-time data, and help buyers understand where they may have room to negotiation.
Analysis:
Speculation that the real estate market is turning is a hot topic across the country, as year-over-year existing home sales have been down or remained flat in many states over the past few months.
In Ada County, existing home sales in September 2018 were down 24.0% compared to the same month last year – and down 25.2% from August 2018. This number marks the first double-digit decline in existing home sales since February 2017 which could easily support that “market turn” discussion.
It’s important to keep in mind that there are a variety of factors affecting our sales figures, primarily the number of existing homes that are even available to purchase which has been consistently down year-over-year for 48 months, or four years. As of September 2018, inventory of existing homes in Ada County was down 19.2% compared the same month the previous year.
Beyond inventory and sales counts, there are three other metrics we’re also watching closely to see which way the market may be moving: days on market, percent of original list price, and months supply of inventory.
Days on market measures the time between when a home is listed and when it goes under contract. As of September 2018, it was at 23 days in Ada County for existing homes, up three days from August, and up five days over July. That’s providing a bit of breathing room for buyers, and potentially the opportunity to negotiate a bit on price.
The percent of original list price received measures the difference between the original listing price and the final sold price, noting any price reductions made by the seller or as negotiated with the buyer. In September, the average percent of original list price received on existing homes (with at least one day on the market) was at 98.1% — down from 99.0% in August, and 99.2% in July.
What does this mean for buyers and sellers? Buyers may feel less frantic in their home search, as market times have slowed as we move into fall and winter. And although sellers are enjoying near-record sales prices, it’s becoming increasingly important to work with your REALTOR® to price your home competitively.
That said, home prices should remain higher year-over-year, though, as the months supply of inventory metric (which measures inventory versus demand) was at just one month in September 2018, where a balanced market, not favoring buyers or sellers, is typically between 4-6 months of supply of inventory.
Whether the closed sales decline is truly an early indicator of the market moving back towards balance, there are many factors that are affecting our current housing market, including the persistent low levels of inventory, seasonality, or even affordability and interest rate concerns. It’s a complex set of factors that will determine where the market goes in the next few months – and REALTORS® are the best-equipped partner to help sellers correctly price their homes based on real-time data, and help buyers understand where they may have room to negotiation.
GEM COUNTY HOME PRICES EDGE UP DUE TO LOW INVENTORY, HIGH DEMAND
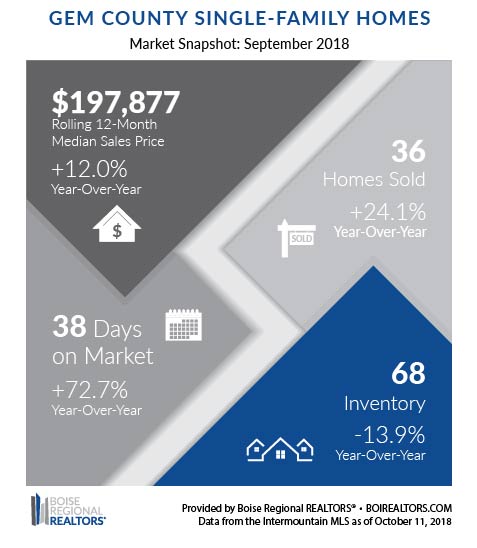
Continuing what we saw in August, in September the supply of housing was down 13.9% from a year ago and sales were up 24.1% in Gem County. The function of supply and demand drove the median sales price for homes that sold in September to $197,877, based on activity over the past 12 months — up 12% over the same period last year.
Price gains were also felt in the city of Emmett. Based on activity in both existing/resale and new construction homes over the past 12 months, the median sales price for the city of Emmett was at $202,500 in September, a gain of 18.3% over the same period last year.
Looking at the supply-demand ratio of months supply of inventory — which takes the number of homes for sale divided by the average number of sales by month — there were 1.6 months in September 2018, down 30.4% year-over-year. A balanced market— not favoring buyers or sellers — is typically between 4-6 months of supply.
One noticeable difference between the August and September numbers was the Days on Market metric, or DOM, which measures the time between when a home is listed and when it goes under contract. Homes that closed in August spent an average of 22 days on the market before going under contract, and homes that closed in September spent an average of 38 days – not a surprising change as we typically see a seasonal slowdown as we head into the fall and winter months.
It’s normal to see the market slow down a bit as we head into winter. If you’re thinking about buying this fall, you may enjoy a less frantic pace than what we experienced in the summer months, and if you’re considering selling, now is a great time because sellers are still receiving great prices on their homes. Either way, work with your REALTOR® who has access to real-time data and the expertise to help make that move a smart one.
RESOURCES:
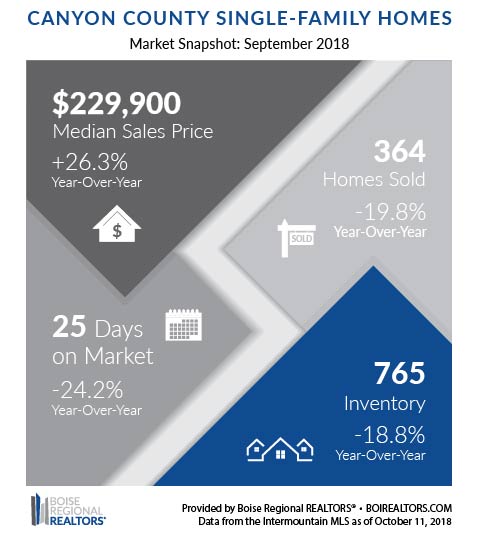
Additional information about trends within the Boise Region, by price point, by existing and new construction, and by neighborhood, are now available here: Ada County, Canyon County, Gem County, and City Data Market Reports. Each includes an explanation of the metrics and notes on data sources and methodology.
Download the latest (print quality) market snapshot graphics for Ada County, Ada County Existing/Resale, Ada County New Construction, Canyon County, Canyon County Existing/Resale, Canyon County New Construction, and Gem County.
# # #
This report is provided by Boise Regional REALTORS® (BRR), a 501(c)6 trade association, representing real estate professionals throughout the Boise region. Established in 1920, BRR is the largest local REALTOR® association in the state of Idaho, helping members achieve real estate success through ethics, professionalism, and connections. BRR has two wholly-owned subsidiaries, Intermountain MLS (IMLS) and the REALTORS® Community Foundation.
If you have questions about this report, please contact Cassie Zimmerman, Director of Communications for Boise Regional REALTORS®. If you are a consumer, please contact a REALTOR® to get the most current and accurate information specific to your situation.
The data reported is based primarily on the public statistics provided by the IMLS, available at: intermountainmls.com. These statistics are based upon information secured by the agent from the owner or their representative. The accuracy of this information, while deemed reliable, has not been verified and is not guaranteed. These statistics are not intended to represent the total number of properties sold in the counties or cities during the specified time period. The IMLS and BRR provide these statistics for purposes of general market analysis but make no representations as to past or future performance. The term “single-family homes” includes detached single-family homes with or without acreage, as classified in the IMLS. These numbers do not include activity for mobile homes, condominiums, townhomes, land, commercial, or multi-family properties (like apartment buildings).


Breanna- in the first line- is the 0% a typo? Thank you for all of your excellent content!
Thank you! It’s corrected.