Market Minute
Each Monday or Tuesday, we take a quick look at what happened in the Ada County housing market in the last seven days. All data is for single family homes and single family homes with acreage, as reported to the Intermountain MLS.
Have questions? Contact BRR Director of Communications Taylor Gray at 208-947-7238.

2023
25
Days on Market for Ada Existing Homes
Ada Existing Home’s DOM Lingers to the 20s in Week 26
The concept that a mere 25 days on market would be considered a “linger” feels a bit comical. However, we’ve witnessed unusually speedy market times since 2020 — revving to 8 days in June 2021 — making the current existing home market speeds feel sluggish in comparison.
This week’s days on market for existing homes in Ada County mirror the pre-COVID times we witnessed in late June 2019, amounting to 30 days. It’s important to remember that year-over-year comparisons recently can feel misleading with the dramatic market differences from the past few years. Reflecting on trends prior to the COVID market can help us “check ourselves.”
Data from the Intermountain MLS for the week ending on 6/25/2023.
$852,953
Average List Price in Ada
Average List Prices Play Tug-o-War in Week 25
Ada and Canyon County have faced off against Elmore and Gem for the past four weeks regarding year-over-year average list price trends.
Landing at an average of $852,953, Ada County rallied 6.6% compared to the same week last year, similar to Canyon’s boost of 7.6% to $688,879. On the other side of the same coin, Elmore and Gem slumped 6.6% and 9.5% respectively.
Canyon County’s new construction sector experienced the largest boost of 17.4% while Gem County’s new construction sector faced the largest bog at 24.3%.
Data from the Intermountain MLS for the week ending on 6/18/2023.
+103.7%
Week-Over-Week Days on Market
Days on Market Remain Steady in Week 24
Average days on market have remained relatively consistent for the past five weeks, fluctuating less than six days across all sectors. Currently, single family homes average 56 days on the market before going under contract compared to 57 days we saw in Week 20.
New construction continues to experience longer wait times at 66 days, a minimal uptick from 63 days in Week 20. The steady pace over the last few weeks will allow the pinch of diminishing inventory — down 21.1% compared to the same week last year — to ease.
Data from the Intermountain MLS for the week ending on 6/11/2023.
+10.9%
Sales in Ada County
Pending and Sale Activity Heat Up in Week 23
This week invited a few spicy upticks in market activity. We saw the second week of higher list price temperatures in Ada County, up 3.8% compared to the same month last year — a continued break from the 33-week streak of declines we’d experienced since October 2022.
New pendings are also up 4.9% year-over-year, shifting from 163 to 171 homes that went pending over the past week.
The balmy increases don’t stop there — Ada County and Canyon County both welcomed positive trends in sales compared to the year prior. Ada’s sales for Week 23 rose to 203, up 10.9%, whereas Canyon saw a hike of 1.0% in closings year-over-year (equating to 99 transactions for the week).
Data from the Intermountain MLS for the week ending on 6/4/2023.
+20.8%
Newly Listed Existing Homes
Ada Says “Hello, Fresh Options” in Week 21
Week 21 showed a significant hike in new listings (on the market for seven or less days) for the existing sector in Ada County — up 20.8% compared to last week and the highest week of newly listed homes we’ve seen since October 2022. While new existing home listings slid 39.8% year-over-year, the growth of overall inventory still brightened by 3.7%.
The fresh faces of existing homes were listed at 4.8% higher than the same week last year, a difference of $37,411. Existing homes, generally, were listed at an average of $925,717 — a spike of $56,614 compared to Week 21 in 2022.
Data from the Intermountain MLS for the week ending on 5/21/2023.
1,054
Pending Sales in Ada County
Ada Inventory Growth Bogs as Pendings Spike in Week 20
Week 20 showed a slow-down for inventory growth in Ada County with only a 6.2% increase compared to the same week last year, which yielded a 142.5% increase. This is the smallest accumulation we’ve seen since July 2021.
This follows in the wake of 1,054 pending contracts and 138 sales in Ada this week. While both data points are down, year-over-year, Week 20 proved to be the highest traffic for pendings since October 2022, which is expected during spring and summer.
Consistent with increased market speed, the decrease in year-over-year shifts for average list price in Ada County has eased. We’ve seen steady weekly increases in the average list price since January this year, with a limited back-and-forth bounce in March.
Data from the Intermountain MLS for the week ending on 5/14/2023
-36.1%
Days on Market for Ada Resale Homes
Sellers Get Upper Hand in Week 18
Existing home sales heated up in Week 18, mounting to 104 sales — the highest sales count we’ve seen for the resale sector in eight weeks. Additionally, we saw a drastic decrease in days on market (DOM) for existing sales; homes stayed on the market for an average of 23 days before going under contract, the fastest we’ve seen in 38 weeks (since August of 2022). Inventory accumulation year-over-year has slowed over the last 21 weeks from 139.1% in December 2022 to 20.0% last week.
As tension between supply and demand grows in the Spring market, median sales prices have also inched upward — last week showed a $15,000 boost from the week before. Historically, median sales prices increase as days on market shrink (see chart, below).
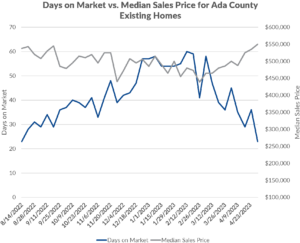
What does this mean moving forward? Resale sellers may not have to wait as long to sell their homes while buyers may face multiple-offer situations.
Data from the Intermountain MLS for the week ending on 5/1/2023
+55.5%
Ada County Inventory YOY Increase
Buyers Have Options, DOM Speed Up in Week 17
Ada County has seen an uptick in inventory for single-family homes — reaching 1,087 which we also saw in Week 13 and is more typical for the late April surge. The additional inventory equated to an increase of 55% from last year’s total of 699 available homes. Consumers can explore fresh options with 101 newly listed properties or explore other active listings such as the 526 new construction homes whose inventory has been positively accumulating year-over-year since the major shortage in August 2021.
Sellers are enjoying approximately 60 days on market, sped up from the 95 days we observed at the beginning of this year. The average list price in Week 17 hovered at $869,934 — up from $730,709 in the fourth week of January and only down 6.2% year-over-year.
Data from the Intermountain MLS for the week ending on 4/24/2023
+187.2%
Year-over-Year Increase in Ada Existing Newly Pendings
Ada Existing Sector Breaks Streak for Newly Pending Homes in Week 16
A 48-week trend has been disrupted in Week 16. Newly pending existing homes — homes under contract with an accepted offer that should close within 30-90 days — are up 187.2% compared to the same week a year ago when we saw uncharacteristically low numbers.
This is a stark contrast to recent weeks. For example, the last 9 weeks showed decreases of anywhere between 20-39%. The shift is fresh but it is important to note that pending sales are the best real-time indicator of demand we have, so we’ll continue to watch this metric carefully.
Data from the Intermountain MLS for the week ending on 4/16/2023
+5.3%
Year-over-Year Increase in Ada New Construction Sales
Sales up for Ada New Construction, Down for Existing Homes in Week 14
The tug between Year-over-Year changes for Ada County new construction sales versus existing sales continues in Week 14. Since Week 5 of 2023, we’ve seen an increase in sales for the new construction sector (this week showing an increase of 5.3%) as opposed to the steady slope of existing home sales (down 29.5% in Week 14).
The higher frequency for new construction sales has not yet stunted the overall inventory growth for the segment — the number of available new construction homes this week sat at 490, an increase of 85.6% from the same week last year. Fox Business warned in a recent article, however, that the nation’s new construction inventory shortage may still cause pressure on sales prices for the foreseeable future.
Data from the Intermountain MLS for the week ending on 4/2/2023.
-31.7%
Average Decrease in Days on Market Since January
Market Continues to Gain Momentum in Week 13
We’ve seen Days on Market ease for all sectors (all single family, existing homes, and new construction) since January 1st of this year. Week 13 shows 66 Days on Market for single family homes, 58 days for existing homes, and 75 days for new construction — an average reduction of 31.7% for each sector.
As the weather warms, the market historically thaws along with it. Spring proves a more reliable time to move when inclement weather doesn’t pose a risk (both frosty and scorching). For example, in 2022, we saw a similar downward slant in Days on Market from January to March — an overall decrease of 37.7%.
Sellers can take steps to prime for a faster market by preparing their homes for open houses and buyers can look into options they may benefit from in terms of financing programs and budgeting.
Data from the Intermountain MLS for the week ending on 3/26/2023.
-3.2%
Average Existing Home List Price
Homeowners List at Lower Prices in Week 12
The average price of listed existing/resale homes has continued to trickle downward. In Week 12, the average list price for homes in this segment was down 3.2%, or nearly $30,000 less, than the average list price in Week 12 of 2022. This marked the 22nd consecutive week of weekly decreases in existing home list prices.
It’s important to note that while list price is a useful forward-looking metric that give us clues about seller sentiment and the market, sales price is the best metric for showing actual price trends, as it reflects any price adjustments or seller concessions to the homes that sold during a given time period.
The median sales price of existing homes that closed in Week 12 was $480,000, down 15.8% — or $90,000 less — than the same week a year ago.
Data from the Intermountain MLS for the week ending on 3/19/2023.
+103.0%
Year-Over-Year Inventory Increase
Inventory Growth Continues to Slow in Week 11
Since Week 5, the year-over-year increase in inventory has decelerated for Ada County.
In Week 5, we saw a year-over-year boost to single family inventory of 160.6%. This week showed an increase of 103.0%. Ada County’s existing home inventory climb slowed progressively from a 165.5% hike in Week 5 to 93.9% in Week 11.
Continuing to add inventory is an important factor in moving toward a balanced market — a market that doesn’t favor buyers over sellers (or vice versa). Historically, a balanced market requires a six months’ supply of inventory (MSI). Our February 2023 Market Report shows we still have progress to make with an MSI of 1.1.
Data from the Intermountain MLS for the week ending on 3/12/2023.
+5.9%
Existing Sales Price Week-Over-Week
Existing Home Sales Prices Increase Week-Over-Week in Week 10
The median sales price of existing homes in Ada County in Week 10 is sitting at $465,000, 15.5% lower than the same week last year but a 5.9% uptick from last week. It is important to note that the median sales price is the best metric for showing price trends during a given time period.
Alternatively, average list price gives a good sense of forward motion in the market. As we move toward the Spring — a season known for more market movement — the gap in year-over-year reductions is closing. List prices have consistently risen since the start of the year and Week 10 showed the highest watermark since June of 2022. Monitoring sales prices will prove if the list price is following market trends or needs to be adjusted.
While seasonal trends and mortgage rates may affect prices, buyers still have time to shop and continue to have negotiation power.
Data from the Intermountain MLS for the week ending on 3/5/2023.
-2.6%
Weekly Sales Year-Over-Year
Existing Sales Down, New Home Sales Up in Week 9
There were 149 homes that closed in Week 9, down 2.6% compared to the same week a year ago. The existing/resale segment had 71 sales for the week, a decline of 41.3% compared to the same week a year ago. However, new construction sales were up 143.8% year-over-year, with 78 sales. It’s important to note that weekly data may seem extreme due to the small sample size.
The median sales price for existing/resale homes that sold in Week 9 was $439,000, 13.9% less than Week 9 of 2022. Existing homes that closed last week spent an average 41 days on the market before going under contract, the fastest weekly average market time for that segment that we’ve seen since late November 2022.
Data from the Intermountain MLS for the week ending on 2/26/2023.
-3.8%
Newly Pending Sales Year-Over-Year
Contract Signings Down Slightly in Week 8
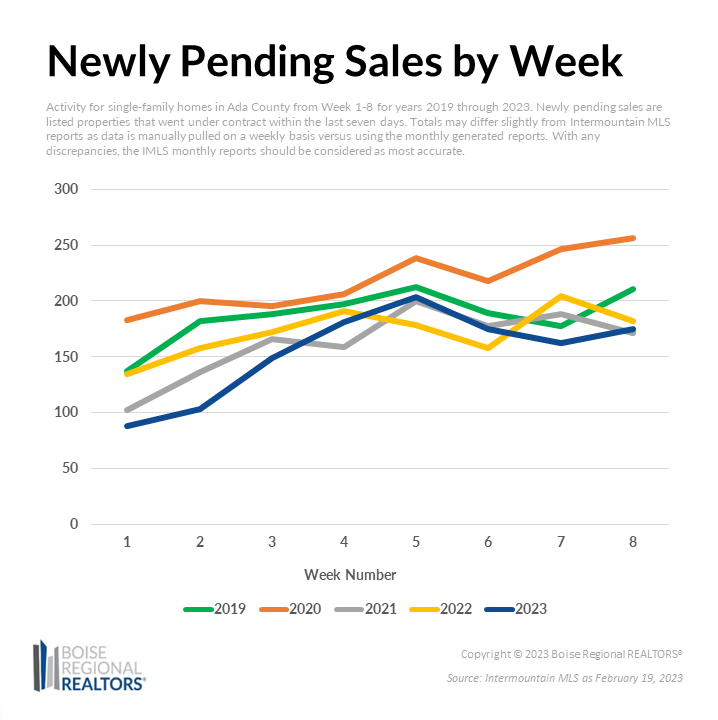
There were 175 newly pending sales in the last seven days, down 3.8% compared to the same week last year. In Week 5 and 6 of 2023, we saw more contract signing activity than the same weeks a year prior, but in Week 7 and 8 of 2023, market activity was down year-over-year once again. Weekly data can fluctuate a bit more than monthly data, due to the smaller data sample size, so we’ve included a chart that shows newly pending sales by week for the first eight weeks of 2019 through 2023 for a visual comparison.
According to Freddie Mac, for the last two weeks, the 30-Year Fixed Rate Mortgage Average has trended upwards, reaching 6.32% on Thursday, February 16, 2023. Our second chart shows the inverse relationship between contract signing activity for 2023 and the shifts in the 30-Year Fixed Rate Mortgage Average.
Data from the Intermountain MLS for the week ending on 2/19/2023.
60
Days on Market for Existing Home Sales
Listings Spend More Time on the Market in Week 7
Existing homes in Ada County that closed last week spent an average of 60 Days on Market (DOM) before going under contract, compared to 23 days the same week last year.
Today’s buyers can take more time to view available homes before submitting offers, and with 1,128 total active listings, buyers have many more options to choose from compared to a year ago. Motivated sellers will price competitively and consider offering incentives, such as closing cost credits, to attract buyers.
Data from the Intermountain MLS for the week ending on 2/13/2023.
+ 10.8%
Contract Signings
Contract Signings up in Week 6
For the second week in a row, new contract signings were up year-over-year. There were 175 newly pending sales in the last seven days, up 10.8% compared to the same week last year. This is significant as Week 5 was the first time we had an increase in new contract signings since Week 19 of 2022 and may indicate that demand has bottomed out and is beginning to recover.
The new construction segment led the way with a 34.5% increase in newly pending sales compared to Week 6 of 2022, while existing/resale segment was down 1.9% compared to the same week last year. There were a total of 74 new homes and 101 existing/resale homes that went under contract in Week 6 of 2023.
Data from the Intermountain MLS for the week ending on 2/5/2023.
+ 14.0%
Contract Signings
Contract Signings up in Week 5
There were 203 newly pending sales in the last seven days, up 14.0% compared to the same week last year. This is the first time we’ve had an increase in new contract signings since Week 19 of 2022 (early May). This uptick in activity coincides with the lowest 30-Year Fixed Rate Mortgage Average we’ve seen in four months. According to Freddie Mac, the average rate for a 30-year fixed rate mortgage was 6.13% on Thursday, January 26, 2023.
The new construction segment led the way with a 38.6% increase in newly pending sales compared to Week 5 of 2022, while existing/resale segment was down 1.9% compared to the same week last year. There were a total of 97 new homes and 106 existing/resale homes that went under contract in Week 5 of 2023.
Data from the Intermountain MLS for the week ending on 1/29/2023.
-16.0%
Average List Price for Existing Homes
Homeowners List at Lower Prices in Week 4
The average price of listed existing/resale homes has trended down in the last year. In Week 4, the average list price for homes in this segment was down 16.0%, or nearly $150,000 less, than the average list price in Week 4 of 2022.
It’s important to note that while list price is a useful forward-looking metric that give us clues about seller sentiment and the market, sales price is the best metric for showing actual price trends, as it reflects any price adjustments or seller concessions to the homes that sold during a given time period.
The median sales price of existing homes that closed in Week 4 was $465,000, down 13.1%, or $70,000 less, than the same week a year ago.
Data from the Intermountain MLS for the week ending on 1/22/2023.
97
New Contract Signings for Existing Homes
Contract Signings Down Slightly in Week 3
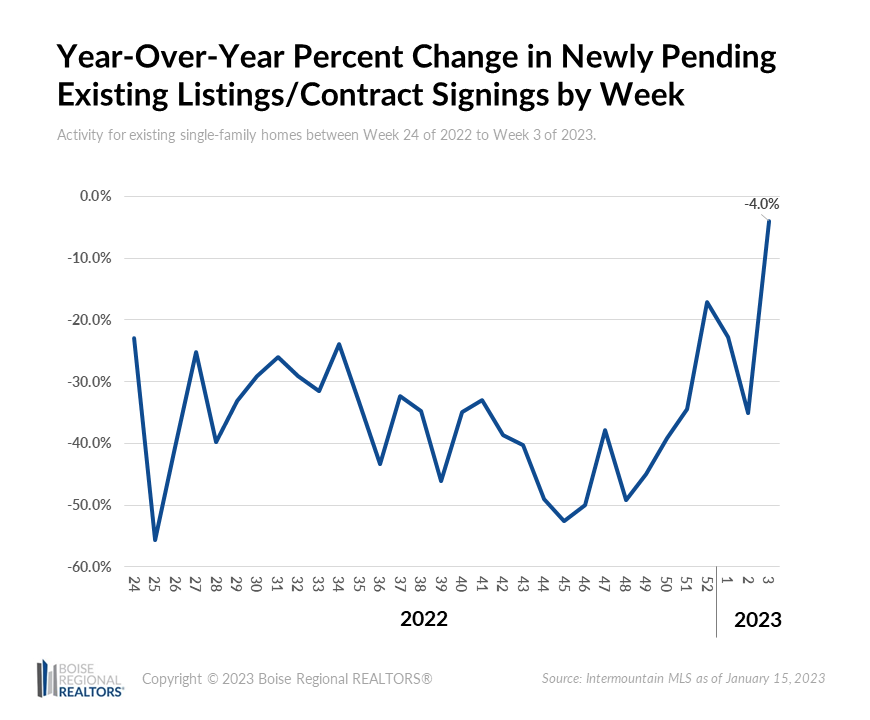
There were 97 new contract signings for existing/resale properties within the last seven days in Week 3. This is notable because it is a decrease of only 4.0% compared to the same week last year and the first time we didn’t have a double digit year-over-year decline for this metric since Week 23 of 2022 (first week of June 2022). Contract signings have been down since mid-2022 due to the impact that higher mortgage interest rates have had on demand for housing.
After peaking at an average of 7.08% on November 10th, 2022, the 30-Year Fixed Rate Mortgage Average according to Freddie Mac, has since declined to 6.33% on January 12, 2023. As rates settle and stabilize, our market should see increases in activity.
Data from the Intermountain MLS for the week ending on 1/15/2023.
68
Newly Listed Existing Homes
More Homeowners List in Week 2
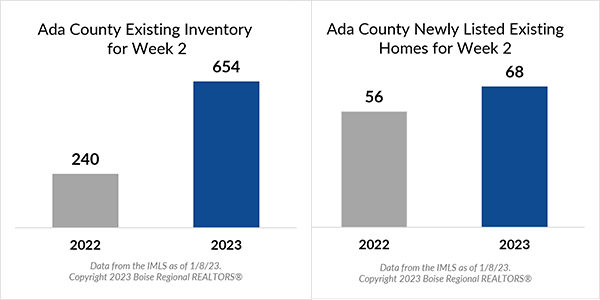
There were 654 existing homes available on the market in Week 2 of 2023, up 172.5% compared to the same week last year. Overall existing inventory is up due to accumulation of inventory with homes spending more time on the market, as well as an uptick in newly listed existing homes last week. 68 homeowners listed their homes for sale within the last seven days, 21.4% more than the same week a year ago.
Data from the Intermountain MLS for the week ending on 1/8/2023.
57
Days on Market
Listings Spend More Time on the Market in Week 1
Existing homes in Ada County that closed last week spent an average of 57 Days on Market (DOM) before going under contract, compared to 30 days the same week last year.
Today’s buyers can take more time to view available listings before submitting offers, and with 1,443 total active listings, buyers have many more options to choose from than a year ago. Sellers can expect their listed homes to sit on the market a bit longer than what we saw last year and may consider offering incentives to attract buyers.
Data from the Intermountain MLS for the week ending on 1/1/2023.
2022
80
Existing Home Sales
Existing Home Sales Up in Week 52
There were 80 existing/resale homes that closed in Week 52, up 15.9% compared to the same week a year ago. This is the first year-over-year increase in weekly existing home sales we’ve seen for Ada County in 26 weeks, or since mid-June. It’s important to note that weekly data may seem extreme due to the small sample size.
While we can’t consider the uptick in last week’s sales a trend, it’s certainly a metric worth keeping an eye on in the new year to see if existing sales rebound.
Data from the Intermountain MLS for the week ending on 12/25/2022.
134
Home Sales
Home Sales Down in Week 51
There were 134 homes that closed in Week 51, down 33.7% compared to the same week a year ago. The existing/resale segment had 73 sales for the week, a decline of 49.0% compared to a year ago. However, new construction sales were up 6.8% year-over-year, with 63 sales. It’s important to note that weekly data may seem extreme due to the small sample size.
Sales have trended down compared to last year in large part due to higher mortgage interest rates. Higher rates equate to higher monthly mortgage payments for buyers who finance a home purchase, which has caused some potential buyers to make budget adjustments, and others to press pause on their home search for the time being.
Speaking of mortgage interest rates, according to Freddie Mac, the 30-Year Fixed Rate Mortgage Average in the United States has dropped from the most recent high of 7.08% on November 10, 2022, to 6.31% on December 15, 2022. This dip in rates will help with affordability for those looking to purchase a home, and we’ll keep an eye on pending contracts and sales data to see if this spurs additional activity.
Data from the Intermountain MLS for the week ending on 12/18/2022.
1,772
Homes for Sale
Inventory up YOY in Week 50
There were 1,772 homes for buyers to choose from in Week 50 of 2022, up 141.1% compared to the same week last year. Of those, 935 were existing homes and 837 were new construction homes. Weekly inventory has been up year-over-year since Week 29 of 2021, for a total of 74 consecutive weeks.
Overall inventory is up, due in part to listings spending more time on the market before going under contract. The average days on market (DOM) of existing homes that closed last week was 43 days, compared to 29 days a year ago.
Data from the Intermountain MLS for the week ending on 12/11/2022.
89
Newly Listed Existing Homes
Fewer Homeowners List in Week 49
There were 995 existing homes available on the market in Week 49 of 2022, up 115.8% compared to the same week last year. Overall existing inventory is up due to accumulation of inventory with homes spending more time on the market, however, new listings are down 70.0% compared to the same week last year, with 89 homeowners listing within the last seven days. This is the 21st week of consecutive year-over-year declines in the number of newly listed existing homes, and the largest decline we’ve seen since we began tracking the metric in 2020.
Data from the Intermountain MLS for the week ending on 12/04/2022.
89
New Contract Signings
Contract Signings Down in Week 48
There were 89 new contract signings or listed properties that went into pending status within the last seven days in Week 48. This is a decrease of 48.9% compared to the same week last year and marked the 29th consecutive week of year-over-year declines. Contract activity has slowed in recent months due to the impact of higher mortgage interest rates and home prices on monthly mortgage payments.
New contract signings are typically slower during the winter months due to the holidays and colder weather. We’ll be keeping a close eye on contract activity and new listings for an indication of buyer and seller behavior for the remainder of the year and into 2023.
Data from the Intermountain MLS for the week ending on 11/27/2022.
48
Days on Market for Existing Home Sales
Listings Spend More Time on the Market in Week 47
Existing homes in Ada County that closed last week spent an average of 48 Days on Market (DOM) before going under contract, compared to 24 days the same week last year.
This is the longest DOM for existing homes we’ve seen since we began tracking weekly data in 2020, however, it’s a normal market pace for Ada County based on historical data. Today’s buyers can take more time to view available listings before submitting offers, and with 2,023 total active listings, buyers have many more options to choose from than a year ago. Sellers can expect their listed homes to sit on the market a bit longer than what we saw last year and may need to consider offering incentives to attract buyers.
Data from the Intermountain MLS for the week ending on 11/20/2022.
87
Existing Home Sales
Existing Home Sales Down in Week 46
There were 118 homes that closed in Week 46, down 33.0% compared to the same week a year ago. The existing/resale segment had 87 sales for the week, a decline of 34.1% compared to a year ago. There were 58 new construction sales, an increase of 31.8% from last year, and the second consecutive week that new sales were up, year-over-year. It’s important to note that weekly data may seem extreme due to the small sample size.
Sales have trended down due to larger monthly mortgage payments buyers face with higher mortgage interest rates and home prices, which have caused some potential buyers to make budget adjustments, and others to press pause on their home search for the time being.
Data from the Intermountain MLS for the week ending on 11/13/2022.
104
Newly Listed Existing Homes
Fewer Homeowners List in Week 45
There were 1,190 existing homes available on the market in Week 45 of 2022, up 73.2% compared to the same week last year. Overall existing inventory is up due to accumulation of inventory with homes spending longer times on the market, however, new listings are down 60.8% compared to the same week last year, with 104 homeowners listing within the last seven days. This is the 17th week of consecutive year-over-year declines in the number of newly listed existing homes.
Data from the Intermountain MLS for the week ending on 11/06/2022.
41
Days on Market for Existing Home Sales
Listings Spend More Time on the Market in Week 44
Existing homes in Ada County that closed last week spent an average of 41 Days on Market (DOM) before going under contract, compared to 18 days the same week last year.
Metrics that indicate competition in the market continued to show signs of normalizing in recent months compared to highly competitive conditions we experienced in 2021. Today’s buyers can take more time to view available listings before submitting offers, and with 2,182 total active listings, buyers have many more options to choose from than a year ago. Sellers can expect their listed homes to sit on the market a bit longer than what we saw last year and may need to consider offering incentives to attract buyers.
Data from the Intermountain MLS for the week ending on 10/30/2022.
2,238
Listed Homes
Inventory up in Week 43
There were 2,238 homes for buyers to choose from in Week 43 of 2022, up 96.7% compared to the same week last year. Of those, 1,313 were existing homes and 925 were new construction homes. Weekly inventory has been up year-over-year since Week 29 of 2021, for a total of 67 weeks.
Overall inventory is up, due in part to listings spending more time on the market before going under contract. However, fewer sellers are listing compared to this time last year. Focusing on the existing segment, 108 homes were listed within the last seven days, 56.7% less than the same week a year ago.
Data from the Intermountain MLS for the week ending on 10/23/2022.
156
Home Sales
Sales Down in Week 42
There were 156 homes that closed in Week 41, down 32.8% compared to the same week a year ago. The existing/resale segment had 102 sales for the week, a decline of 42.0% compared to a year ago. There were 54 new construction sales, a decrease of 3.6% from last year. It’s important to note that weekly data may seem extreme due to the small sample size.
Sales have trended down due to higher mortgage interest rates and higher home prices, which have caused some potential buyers to make budget adjustments, and others to press pause on their home search for the time being.
Data from the Intermountain MLS for the week ending on 10/16/2022.
155
Newly Listed Existing Homes
Fewer Homeowners List in Week 41
There were 1,376 existing homes available on the market in Week 41 of 2022, up 66.6% compared to the same week last year. While overall existing inventory is up, 155 of those were listed within the last seven days, a decrease of 64.2% compared to the same week a year ago. This is the 13th week of consecutive year-over-year declines in the number of newly listed existing homes.
Data from the Intermountain MLS for the week ending on 10/9/2022
37
Days on Market for Existing Home Sales
Listings Spend More Time on the Market in Week 40
Existing homes in Ada County that closed last week spent an average of 37 Days on Market (DOM) before going under contract, compared to 14 days the same week last year.
Metrics that indicate competition in the market continued to show signs of normalizing in recent months compared to highly competitive conditions we experienced in 2021. Today’s buyers can take more time to view available listings before submitting offers. With 2,327 total active listings, buyers have many more options to choose from than a year ago. Sellers can expect their listed homes to sit on the market a bit longer than what we saw last year and may need to consider offering incentives to attract buyers.
Data from the Intermountain MLS for the week ending on 10/2/2022.
119
Existing Home Sales
Existing Sales Down in Week 39
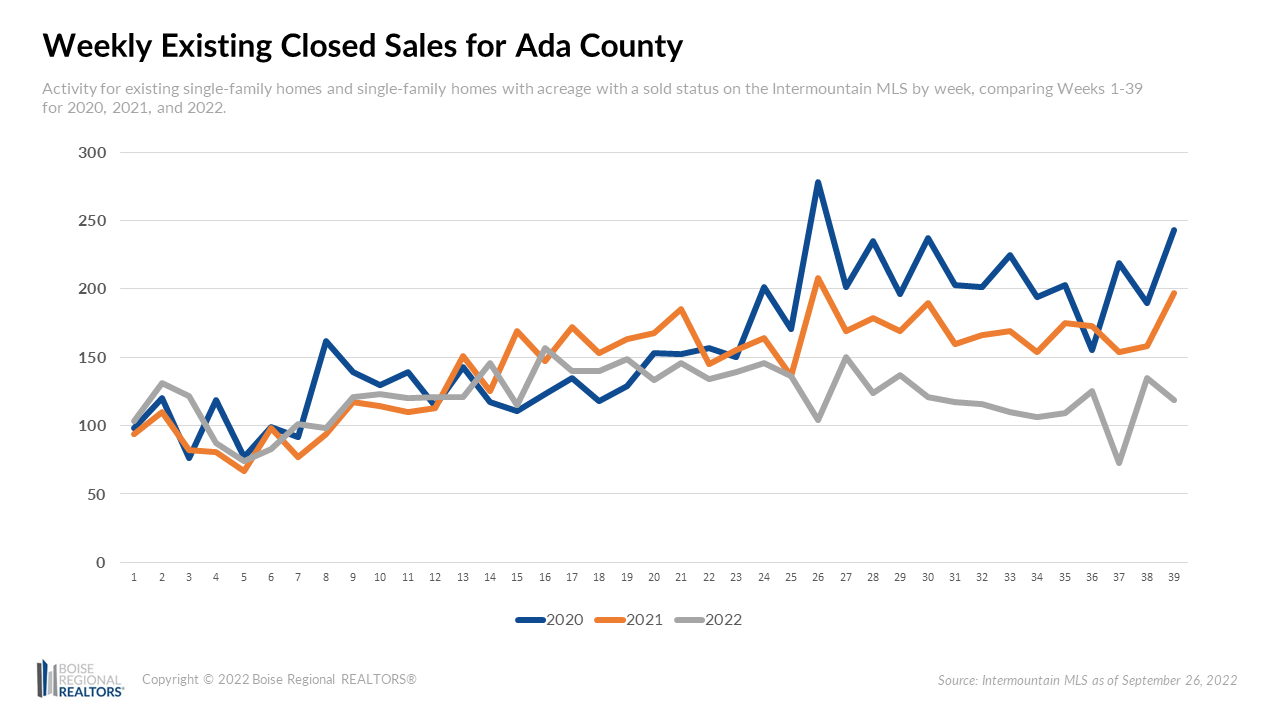
There were 119 existing homes that closed last week, down 39.6% compared to the same week a year ago. This marks 14 consecutive weeks of year-over-year declines in existing sales segment. The median sales price for existing homes that sold in Week 39 was $485,000, a decline of 5.4% from the same week a year ago. It’s important to note that weekly data may seem extreme due to the small sample size, so monthly numbers are a better indicator of the overall market.
Data from the Intermountain MLS for the week ending on 9/25/2022.
110
Home Sales
Sales Down in Week 37
There were 110 homes that closed in Week 37, down 45.0% compared to the same week a year ago. The existing/resale segment had 73 sales for the week, a decline of 52.6% compared to a year ago. There were 49 new construction sales, an increase of 6.5% from last year. It’s important to note that weekly data may seem extreme due to the small sample size.
Sales have trended down due to higher mortgage interest rates and higher home prices, which have caused some potential buyers to make budget adjustments, and others to press pause on their home search for the time being.
Data from the Intermountain MLS for the week ending on 9/11/2022
131
Newly Listed Existing Homes
Fewer Homeowners List in Week 36
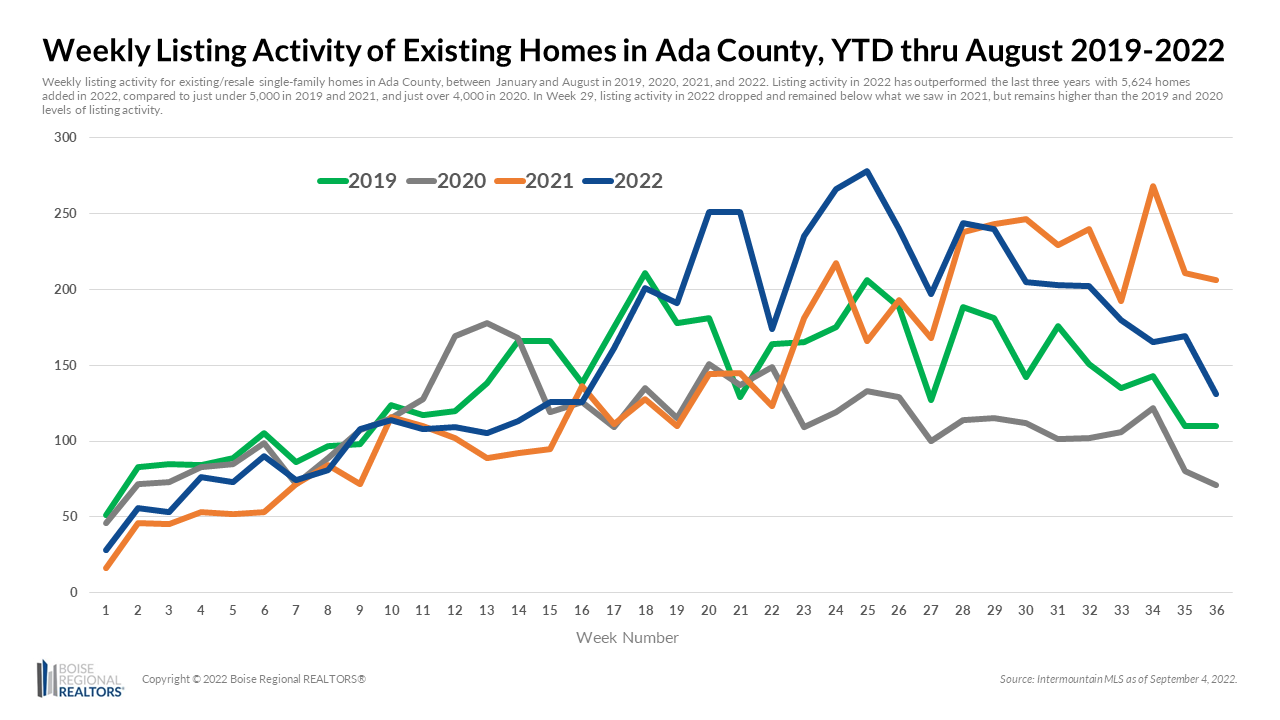
There were 1,487 existing homes available on the market in Week 36 of 2022, up 99.1% compared to the same week last year. While overall existing inventory is up, 131 of those were listed within the last seven days, a decrease of 62.6% compared to the same week a year ago. This is the eighth week of consecutive year-over-year declines in the number of newly listed existing homes.
Listing activity in 2022 has outperformed the last three years with 5,624 homes added in 2022, compared to just under 5,000 in 2019 and 2021, and just over 4,000 in 2020. In Week 29, listing activity in 2022 dropped and remained below what we saw in 2021, but remains higher than the 2019 and 2020 levels. Review the chart below for a comparison of weekly listing activity for all four years.
Data from the Intermountain MLS for the week ending on 9/4/2022.
109
Existing Sales
Existing Sales Down in Week 35
There were 109 existing homes that closed last week, down 37.7% compared to the same week a year ago. The median sales price for existing homes that sold in Week 35 was $520,000, a decline of 0.5% from the same week a year ago. It’s important to note that weekly data may seem extreme due to the small sample size, so monthly numbers are a better indicator of the overall market. However, in both weekly and monthly data, we’re seeing sales trend down.
Higher mortgage rates, coupled with higher home prices are hampering sales. According to Freddie Mac, the 30-Year Fixed Rate Mortgage Average was at 5.5% on August 25, 2022. Higher rates impact monthly payments for buyers who finance their purchase, pricing some out of the market.
Data from the Intermountain MLS for the week ending on 8/28/2022.
28
Days on Market
Listings Spend More Time on the Market in Week 34
Existing homes in Ada County that closed last week spent an average of 28 Days on the Market (DOM) before going under contract, compared to 12 days the same week last year.
Metrics that indicate competition in the market continued to show signs of normalizing in August compared to highly competitive conditions we experienced in 2021. As we move toward a “balanced” market, buyers can take more time to view available listings before submitting offers. Sellers can expect their listed homes to sit on the market a bit longer than what we saw last year and may need to consider offering incentives to attract buyers.
Data from the Intermountain MLS for the week ending on 8/21/2022.
152
Newly Pending Homes
Pending Sales Decline in Week 33
There were 152 new contract signings or listed properties that went into pending status within the last seven days in Week 33. This is a decrease of 26.6% compared to the same week last year and marks 14 consecutive weeks of year-over-year declines.
There were a total of 1,208 homes in pending status, down 24.6% compared to the same week a year ago. As we explored in the July Market Report, higher mortgage interest rates and prices have had a cooling effect on demand and price growth has slowed.
Data from the Intermountain MLS for the week ending on 8/14/2022.
202
Newly Listed Existing Homes
Fewer Homeowners List in Week 32
There were 1,537 existing homes available on the market in Week 32 of 2022, up 123.4% compared to the same week last year. While overall existing inventory is up, 202 of those were listed within the last seven days, a decrease of 65.4% compared to the same week a year ago. This is the fourth week of consecutive year-over-year declines in the number of newly listed existing homes.
Data from the Intermountain MLS for the week ending on 8/7/2022.
116
Existing Home Sales
Existing Sales Down in Week 31
There were 116 existing homes that closed in Week 31, down 30.1% compared to the same week a year ago. It’s important to note that weekly data may seem extreme due to the small sample size, so monthly numbers are a better indicator of the overall market. However, in both weekly and monthly data, we’re seeing sales trend down.
Higher mortgage rates, coupled with higher home prices are hampering sales. According to Freddie Mac, the 30-Year Fixed Rate Mortgage Average was at 5.3% on July 28, 2022. Higher rates impact monthly payments for buyers who finance their purchase, pricing some out of the market.
Data from the Intermountain MLS for the week ending on 7/31/2022.
20
Days on Market for Existing Homes
Longer Market Times in Week 30
Existing homes in Ada County that closed last week spent an average of 20 Days on the Market (DOM) before going under contract, compared to 10 days the same week last year.
The longer market times indicate that the pace of the market has slowed and is beginning to normalize compared to the highly competitive conditions we experienced in 2021. With more inventory options than we’ve seen in years, buyers can take more time to view available listings before submitting offers. Sellers can expect their listed homes to sit on the market a bit longer than what we saw last year and may need to consider offering incentives to attract buyers.
Data from the Intermountain MLS for the week ending on 7/24/2022.
2,201
Active Listings
Continued Inventory Gains in Week 29
There were 2,201 homes for buyers to choose from in Week 29 of 2022, up 156.8% compared to the same week last year. Of those, 1,446 were existing homes and 755 were new construction homes.
Focusing on the existing segment, 240 homes were listed within the last seven days, a slight decrease of 1.2% compared to the same week a year ago. The average list price of existing homes that had been on the market for seven or fewer days was $786,902, an increase of 13.6% compared to the same week last year.
Data from the Intermountain MLS for the week ending on 7/17/2022.
125
New Contract Signings
Contract Signings Down in Week 28
There were 125 new contract signings, or listed properties that went into pending status within the last seven days in Week 28. This is a decrease of 40.5% compared to the same week last year and marked the ninth consecutive week of year-over-year declines.
There was a total of 1,240 homes in pending status, down 26.6% compared to the same week a year ago. As we explored in the June Market Report, higher mortgage interest rates and prices are cooling demand and slowing price growth.
Data from the Intermountain MLS for the week ending on 7/10/2022.
16
Days on Market
Longer Market Times in Week 27
Existing homes in Ada County that closed last week spent an average of 16 Days on the Market (DOM) before going under contract, compared to nine days the same week last year.
The longer market times indicate that the pace of the market has slowed compared to highly competitive conditions we experienced in 2021. With more inventory options than we’ve seen in years, buyers can take more time to view available listings before submitting offers. Additionally, higher mortgage rates and home prices have priced some buyers out of the market, shrinking the buyer pool and decreasing demand.
Data from the Intermountain MLS for the week ending on 7/3/2022.
104
Existing Home Sales
Existing Sales Down in Week 26
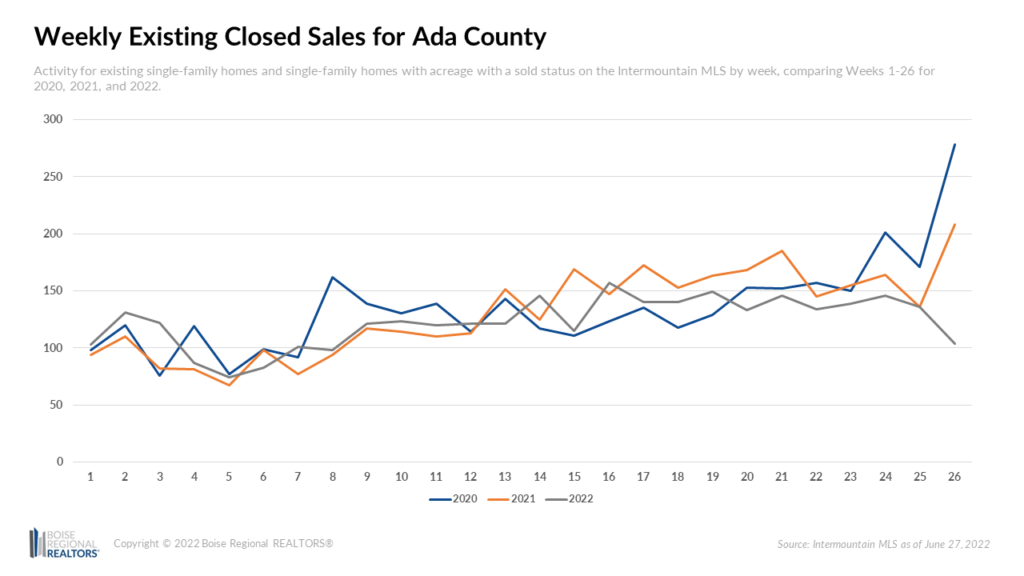
There were 104 existing homes that closed in Week 26, down 50.0% compared to the same week a year ago. It’s important to note that weekly data may seem extreme due to the small sample size, so monthly numbers are a better indicator of the overall market. However, in both weekly and monthly data, we’re seeing sales trend down during a time of the year we typically see the most closings.
Higher mortgage rates, coupled with higher home prices are hampering sales. According to Freddie Mac, the 30-Year Fixed Rate Mortgage Average reached 5.0% in mid-April (Week 16) and was nearing the 6.0% mark at the time of this writing. Higher rates impact monthly payments for buyers who finance their purchase, pricing some out of the market.
Data from the Intermountain MLS for the week ending on 6/26/2022.
-11.0%
Year-Over-Year Change in Average List Price for Existing Homes
Average List Price Down in Week 25
The average list price for existing homes in Ada County was $804,357 in Week 25, down 11.0% compared to the same week a year ago. This is the ninth consecutive week of year-over-year declines in the average list price for the segment. The growth in inventory and slowdown in sales may be putting downward pressure on home prices. However, we’ve yet to see a year-over-year decline in sold price data, as the median sale price for existing homes that sold in Week 25 was $576,000, an increase of 14.7% compared to the same week last year.
Data from the Intermountain MLS for the week ending on 6/19/2022.
1,572
Homes for sale
Inventory up in Week 24
There were 1,572 homes for buyers to choose from in Week 24 of 2022, up 154.4% compared to the same week last year. Of those, 1,031 were existing homes and 541 were new construction homes. This is the most existing supply we’ve seen since we began tracking weekly data in Week 1 of 2020.
Focusing on the existing segment, 266 homes were listed within the last seven days, an increase of 22.6% compared to the same week a year ago. The average price of existing homes that had been on the market for seven or fewer days was $710,664, a decrease of 5.4% compared to the same week last year.
Data from the Intermountain MLS for the week ending on 6/12/2022.
99.3%
% OLP Received
Buyers Pay Less than Asking in Week 23
The average percent of original list price received for existing homes that sold in Ada County last week was 99.3%. This means buyers paid slightly less than asking through a lower accepted offer, price reductions, or seller concessions. In contrast, buyers paid an average of 104.3% of list price for existing homes in Week 23 of 2021.
The median sales price of existing homes that sold last week was $575,000, an increase of 15.0% compared to the same week last year.
Data from the Intermountain MLS for the week ending on 6/5/2022.
134
Existing Home Sales
Existing Sales and Pendings Down in Week 22
There were 134 existing homes that closed in Week 22, down 7.6% compared to the same week a year ago, marking the sixth consecutive week of year-over-year declines.
There were 619 existing homes in pending status, down 14.1% compared to the same week a year ago, marking the tenth consecutive week of year-over-year declines. As we explored in the April Market Report, higher home prices, coupled with higher mortgage rates, may be hampering sales. The average list price of existing homes currently on the market was $863,449, a decrease of 13.6% from the same week a year ago.
Data from the Intermountain MLS for the week ending on 5/29/2022.
7
Days on Market for Existing Home Sales
Days On Market Match 2021
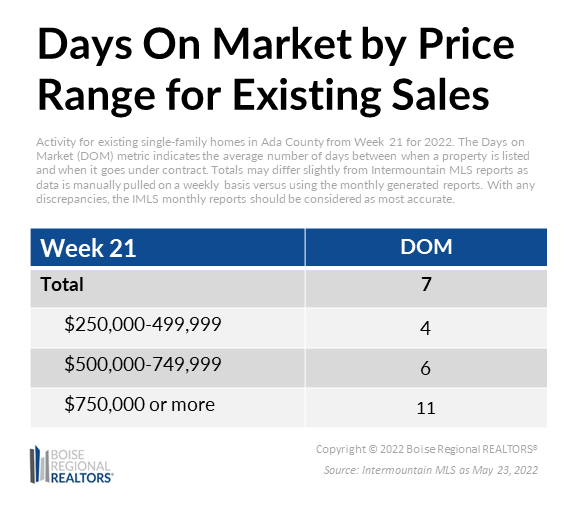
Existing homes in Ada County that closed last week spent an average of seven Days on the Market (DOM) before going under contract, no change from the same week last year.
DOM is just an average though, so some homes are picked up by buyers faster and some are slower to have an accepted offer. When breaking the sales data from last week down by price range, it’s evident that homes priced at lower price points are selling a bit faster than those with higher prices.
Active existing listings that have not yet received an accepted offer have been on the market an average of 25 days — one day less than the same week a year ago.
Data from the Intermountain MLS for the week ending on 5/22/2022.
251
Newly Listed Existing Homes
Inventory Increases in Week 20
There were 680 existing homes available on the market in Week 20 of 2022, up 133.7% compared to the same week last year. 251 of those were listed within the last seven days, an increase of 74.3% compared to the same week a year ago.
In Week 20 of 2022, the average price of existing homes that had been on the market for 7 or fewer days was $775,854, an increase of 18.1% compared to the same week in 2021.
Data from the Intermountain MLS for the week ending on 5/15/2022.
200
Home Sales
Closed Sales Down in Week 19
There were 200 homes that closed in Week 19, down 11.9% compared to the same week a year ago. 149 of those properties were existing homes which was a year-over-year decline of 8.6% and marking the third week of year-over-year declines in existing home sales.
Pending sales for the existing segment have also been declining since Week 12 of 2022. As we explored in the April Market Report, higher home prices, coupled with higher mortgage rates, may be hampering sales. Pending sales are the best real time indicator of demand we have, so we’ll continue to watch this metric carefully.
Data from the Intermountain MLS for the week ending on 5/8/2022.
484
Existing Homes Available
More Homeowners List in Week 18
There were 484 existing homes available on the market in Week 18 of 2022, up 92.8% compared to the same week last year. 201 of those were listed within the last seven days, an increase of 57.0% compared to the same week a year ago.
In Week 18 of 2022, the average price of existing homes that had been on the market for 7 or fewer days was $726,085, an increase of 7.2% compared to the same week in 2021.
Data from the Intermountain MLS for the week ending on 5/1/2022
404
Existing Homes Available
Active Existing Inventory Up In Week 17
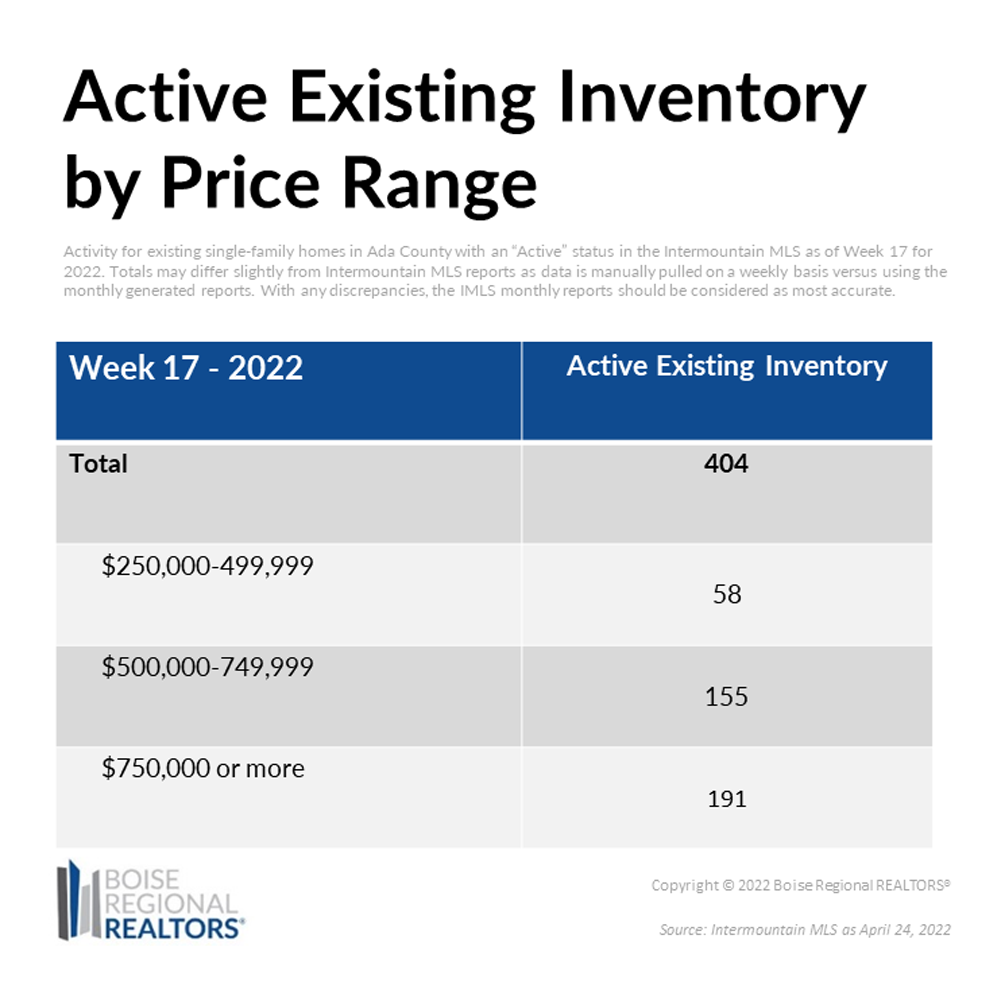
There were 404 existing homes available on the market in Week 17 of 2022, up 77.2% compared to the same week last year. 161 of those were listed within the last seven days, an increase of 45.0% compared to the same week a year ago.
The vast majority of available existing properties were listed at or above $500,000. See the full breakdown by price point in the chart below.
Data from the Intermountain MLS for the week ending on 4/24/2022
78
Newly Pending Homes
Buyer Activity Down in Week 16
There were 78 homes that went into pending status in Week 16, down 63.7% compared to the same week a year ago. 47 of those properties were existing homes which was a year-over-year decline of 73.3% compared to Week 16 of 2021 when 176 homes went under contract.
Is it possible that the demand for homes is lessening due to the increase in home prices and the fact that the 30-Year Fixed Rate Mortgage Average reached 5.0% on April 14, 2022? We can’t say for sure, as weekly data can fluctuate due to the small number of transactions, and a one-time decline is certainly not a trend. However, pending data is the best real time indicator of demand we have, so we’ll be watching this metric carefully.
Data from the Intermountain MLS for the week ending on 4/17/2022.
15
Days On Market
Days on Market Vary by Price Point
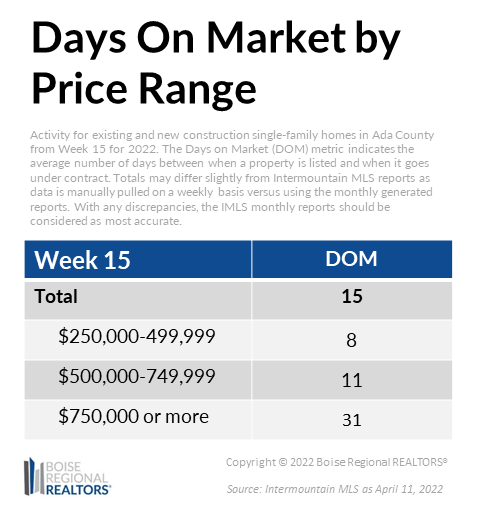
Existing homes in Ada County that closed last week spent an average of 15 days on the market (DOM) before going under contract. This is an increase of 173.2% compared to the same week last year when existing homes were spending just five days on the market before having an accepted offer.
DOM is just an average though, so some homes are snatched up by buyers faster and some are slower to have an accepted offer. When breaking the sales data from last week down by price range, it’s evident that homes priced at lower price points are selling much faster than those with higher prices.
Data from the Intermountain MLS for the week ending on 4/10/2022.
113
Newly Listed Existing Homes
More Homeowners List Compared to Last Year
There were 314 existing homes available on the market in Week 14 of 2022, up 63.5% compared to the same week last year. 113 of those were listed within the last seven days, an increase of 22.8% compared to the same week a year ago. Fewer existing homes are hitting the market each week than in 2020, but we’re seeing slightly more come online on a weekly basis compared to 2021.
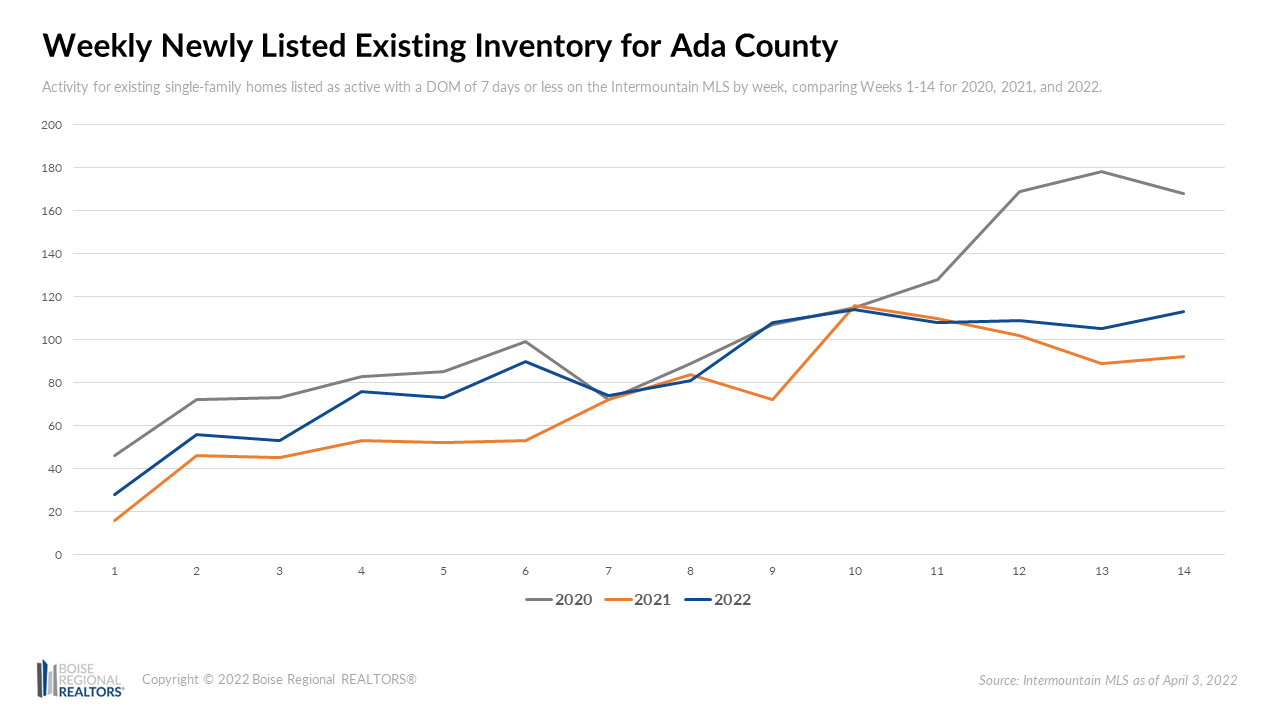
In Week 14 of 2022, the average price of homes that had been on the market for 7 or fewer days was $751,430, an increase of 28.3% compared to 2021.
Data from the Intermountain MLS for the week ending on 4/3/2022.
9
Days on the Market for Existing Home Sales
Market Picks up Pace
Existing homes in Ada County that closed last week spent an average of nine days on the market (DOM) before going under contract. This is an increase of 16.2% compared to the same week last year when existing homes were spending an average of eight days on the market before having an accepted offer, but a significant drop compared to last week when DOM for existing sales was 13 days.
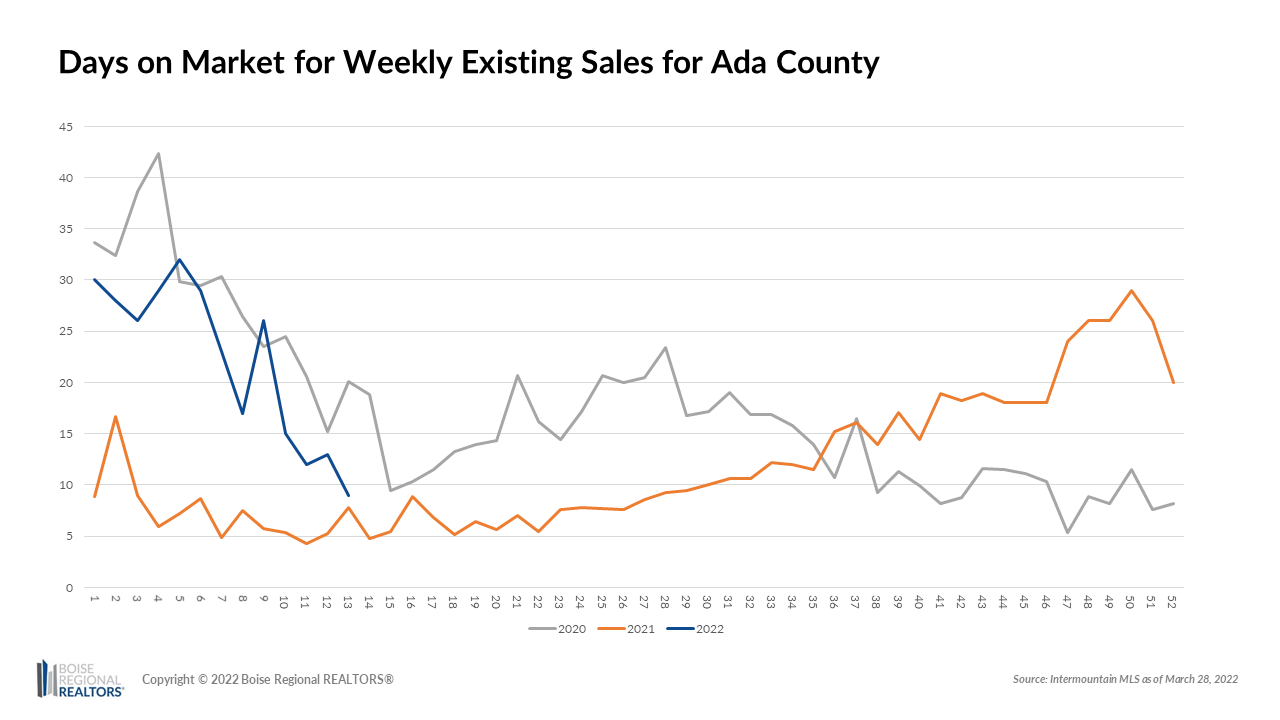
For much of early 2021, the weekly DOM hovered below 10 days, which coincided with record lows in available existing inventory. While the market isn’t quite as quick as what we saw last year, DOM has trended down and may be a precursor to what’s to come as the spring market continues to ramp up.
Data from the Intermountain MLS for the week ending on 3/28/2022.
576
Existing Homes with a Pending Status in Week 12
Pending Sales Update
There were 576 existing homes with a pending status in Week 12, down 4.5% compared to the same week in 2021. This was the first year-over-year decline in pending sales in 19 weeks. There was also a decline when focusing on the status changes within the last week — with 13.5% fewer existing homes that changed to pending status compared to Week 12 of 2021.
As pending sales data can be an indicator for housing demand, could this mean that demand for homes is lessening? We can’t say for sure, as weekly data can fluctuate due to the small number of transactions, and a one-time decline is certainly not a trend. But with rising home prices, pending data is the best real time indicator of demand we have, so we’ll be watching this metric carefully.
Data from the Intermountain MLS for the week ending on 3/20/2022.
+18.3%
YOY Increase in New Pending Sales
New Pending Sales Up
There were 252 homes that went pending in the last seven days, up 18.3% compared to Week 11 of 2021. 163 of those were existing/resale homes, an increase of 10.9% the same week a year ago, and 89 were new homes, an increase of 34.8% year-over-year.
There were 161 closed sales last week for the county — down 18.3% compared to the same week last year. 41 of those sales were new homes, a year-over-year decline of 52.9%, while 120 were existing/resale homes, a year-over-year increase of 9.1%.
Data from the Intermountain MLS for the week ending on 3/13/2022.
194
Closed Sales
Home Sales Increase Slightly
With 194 closed sales in Ada County last week, sales were up 1.0% compared to Week 10 of last year. This slight increase follows six weeks of year-over-year declines in sales. New construction sales continue to lag behind last year’s performance, down 9.0% in Week 10 compared to the same week last year, while existing sales were up 7.9%.
However, we may see closed sales for the new segment pick up in the coming weeks, as there were 72 new construction homes that went into Pending status in the IMLS within the last 7 days, an increase of 35.8% compared to the same time period in 2021.
Data from the Intermountain MLS for the week ending on 3/6/2022.
108
Newly Listed Existing Homes
Newly Listed Existing Homes Increase
There were 249 existing homes available on the market in Week 9 of 2022, up 91.5% compared to the same week last year. 108 of those were listed within the last seven days, an increase of 50.0% compared to the same week a year ago. Combined with and 225 new construction homes, there were a total of 474 homes for buyers to choose from in Week 9, 73.0% more than the same week in 2021.
Data from the Intermountain MLS for the week ending on 2/28/2022.
17
Days on Market for Existing Home Sales
Days on Market Decreases in Recent Weeks
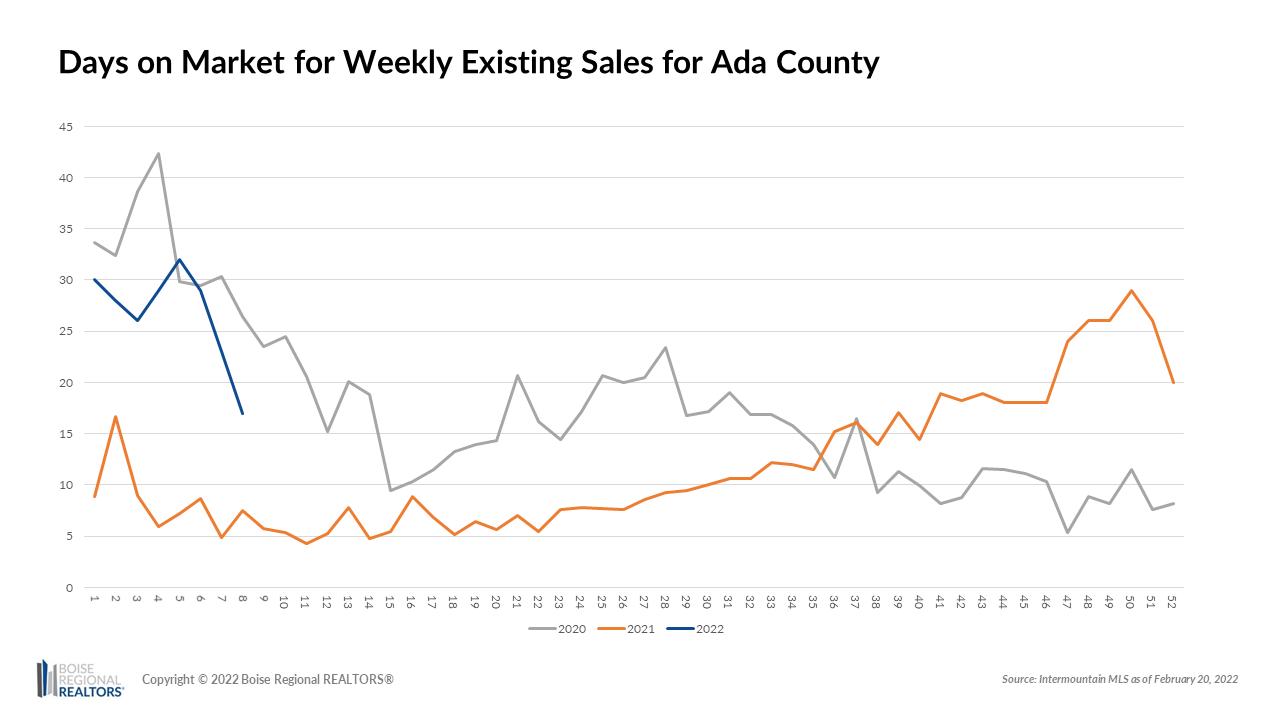
Existing homes in Ada County that closed last week spent an average of 17 days on the market (DOM) before going under contract. This is an increase of 128.0% compared to the same week last year when existing homes were spending an average of seven days on the market before having an accepted offer, but a drastic drop compared to Week 5 of 2022 when DOM was 32.
For much of early 2021, the weekly DOM hovered below 10 days, which coincided with record lows in available existing inventory. Until the last few weeks, homes were spending more time on the market in 2022, giving buyers a bit more time to consider their options. While the market isn’t quite as quick as what we saw last year, DOM has trended down and may be a precursor to what’s to come in the coming weeks.
Data from the Intermountain MLS for the week ending on 2/20/2022.
96.3%
% Original List Price Received
Sizable Share of Existing Homes Selling for Over List Price
In our January 2022 Market Report, we noted that the Percent of Original List Price Received for existing homes that sold was 97.3%, meaning that, on average, buyers paid less than asking through a lower accepted offer and/or seller concessions. We wanted to follow up on that statistic and see if a similar figure was reflected in the second week of February.
For all existing home sales that closed in the last seven days, the Percent of Original List Price received was 96.3%. There were 101 existing sales — 40 of which sold for over list price and 61 that did not. Buyers who paid more than asking spent an average of $13,032 over the original list price.
That being said, we’ve heard from multiple REALTORS® that competition is again heating up and multiple offers are on the rise, which is a trend we’ll be keeping an eye on as we head into the spring.
Data from the Intermountain MLS for the week ending on 2/13/2022.
213
Available Existing Homes
Year-Over-Year Inventory Gains
There were 213 existing homes available on the market in Week 6 of 2022, up 102.9% compared to the same week last year. 90 of those were listed within the last seven days, an increase of 69.8% compared to the same week a year ago. Combined with and 249 new consecution homes, there were a total of 462 homes for buyers to choose from in Week 6, 77.7% more than the same week in 2021.
Data from the Intermountain MLS for the week ending on 2/6/2022.
32
Days on Market
Pace of Market Slows, Fewer Buyers Paying Over List
Existing homes in Ada County that closed last week spent an average of 32 days on the market (DOM) before going under contract. This is an increase of 343.9% compared to the same week last year when existing homes were spending an average of just seven days on the market before having an accepted offer. Last week’s average market time was the slowest we’ve seen since in two years.
Not only are existing homes selling at a slower pace than a year ago, but fewer are selling for over list price and the average amounts paid over list have decreased. In Week 5 of 2022, 23.0% of existing home sales were for over original list price. Of those homes, the average paid over list was $20,612. In contrast, in Week 5 of 2021, 75.4% of all existing home sales were for over list price. Of the homes that sold for more than asking, the average paid over list was $35,831.
Data from the Intermountain MLS for the week ending on 1/30/2022
118
Weekly Home Sales
With 118 closed sales in Ada County last week, sales were down 32.6% compared to Week 4 of last year. This can be attributed to a 67.0% year-over-year slump in weekly sales for the new construction segment since sales of existing homes were up 7.4%.
There were 191 properties that went into Pending status in the IMLS within the last 7 days, an increase of 20.1% compared to the same time period in 2021. 122 of these were existing homes which is up 35.6% year-over-year, indicating that the demand for existing homes remains strong.
Data from the Intermountain MLS for the week ending on 1/24/2022
213
Existing Homes Available
There were 213 existing homes and 277 new homes available at the end of the week, less than a week ago, but a 142.0% and 29.4% year-over-year increase, respectively. Of existing inventory, 53 were listed within the last seven days, an increase of 17.8% compared to the same week in 2021.
New construction options outnumbered existing homes throughout all the weeks of 2020. That dynamic flipped in late February during 2021, when there was an uptick in existing listings and new construction inventory was hampered by increasing costs and supply chain woes. In December 2021, new construction homes once again outnumbered available existing homes, likely due to the fact homeowners are less likely to list in the winter months compared to the spring and summer.
Data from the Intermountain MLS for the week ending on 1/16/2022
56
Newly Listed Existing Homes
Homeowners continue to list as we head into the new year, with 240 existing homes available on the market in the last week, up 158.1% compared to the same week last year. 56 of those were listed within the last seven days, an increase of 21.7% compared to the same week a year ago. Combined with the 300 new construction homes, there were a total of 540 homes for buyers to choose from in the last week, 66.7% more than the same week in 2021.
Data from the Intermountain MLS for the week ending on 1/9/2022
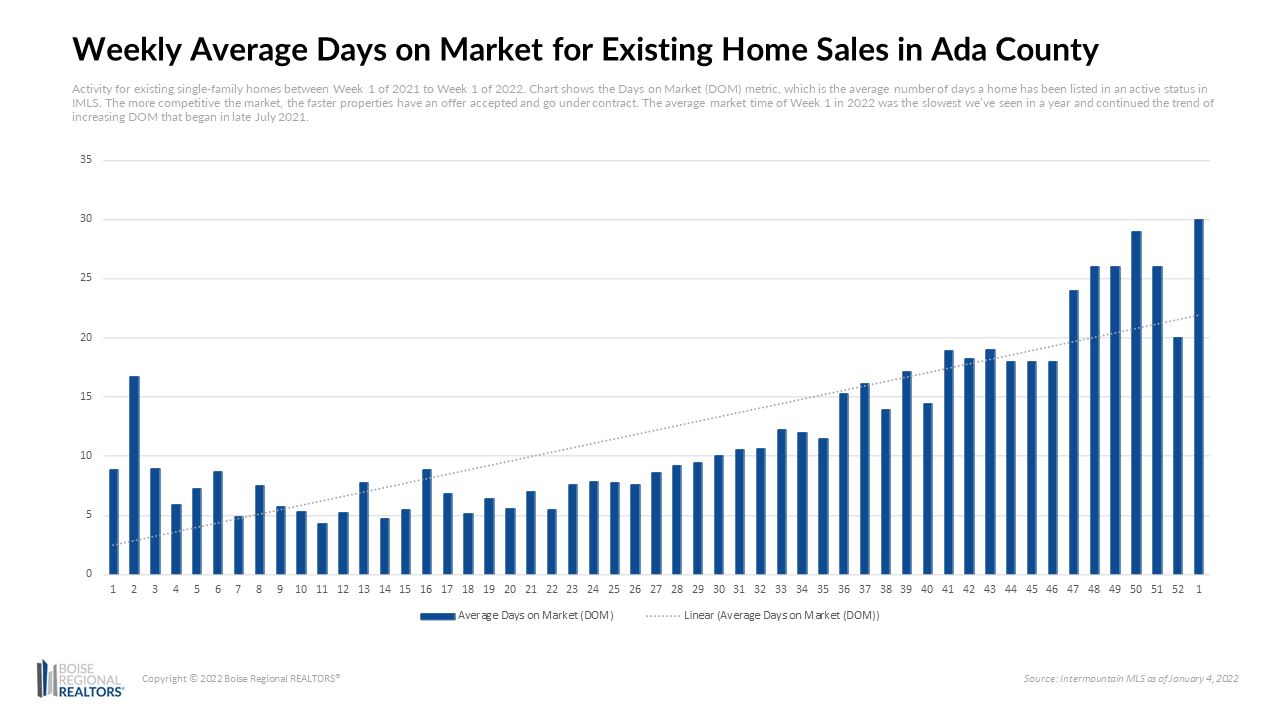
Existing homes in Ada County that closed last week spent an average of 30 days on the market (DOM) before going under contract. This is an increase of 239.4% compared to the same week last year when existing homes were spending an average of nine days on the market before having an accepted offer. Last week’s average market time was the slowest we’ve seen in a year and continued the trend of increasing DOM that began in late July 2021.
Data from the Intermountain MLS for the week ending on 1/2/2022.
2021
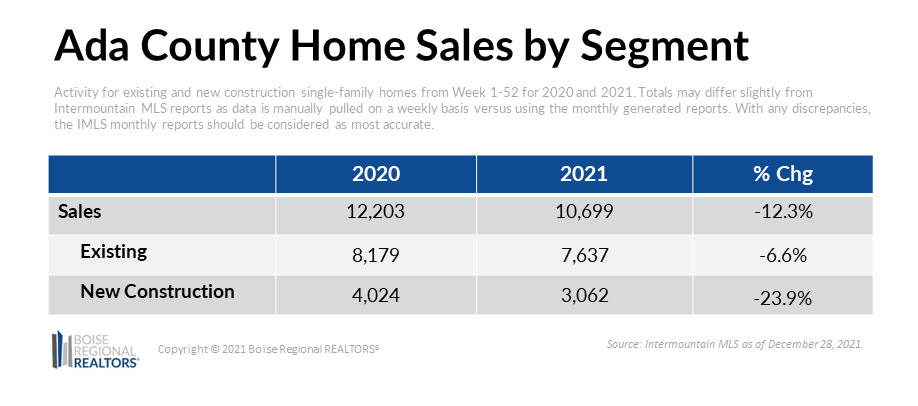
There were 128 home sales in Ada County for the last full week of 2021, down 13.5% compared to the same week last year. Of those sales, 59 were new homes and 69 were existing/resale homes. While the final year end sales data is not yet available, our weekly database indicates that sales were down across the board when compared to last year, particularly in the new home segment.
Data from the Intermountain MLS for the week ending on 12/28/2021.
348
Existing Inventory
As we head into the Christmas holiday week, there were 348 existing homes available for purchase in Ada County as of December 19, 2021, up an impressive 266.3% compared to the same week a year ago. Existing inventory is up year-over-year for two reasons:
1) More homeowners are ready to sell, with 55 existing homes being listed within the last seven days, up 48.6% compared to the same week last year.
2) Existing homes are spending more time on the market before going under contract. Homes that sold in the last week spent an average for 26 days before having an accepted offer, an increase of 242.1% compared to the eight days we saw for the same week a year ago.
Data from the Intermountain MLS for the week ending on 12/19/2021.
391
Existing Inventory
There were 391 existing homes and 344 new homes available at the end of the week, less than a week ago, but a 228.6% and 33.3% year-over-year increase, respectively. Weekly inventory for existing and new homes continues to outpace what we saw last year in Ada County.
As we explored in our November Market Report, there is a strong correlation between the existing inventory and new construction pending sales (properties under contract with an accepted offer that should close within 30-90 days). Looking at activity since January 2019, we have seen new construction pending sales go up when existing inventory dips, then begin to slip as existing inventory increases. Read more in our November Market Report.
Data from the Intermountain MLS for the week ending on 12/12/2021.
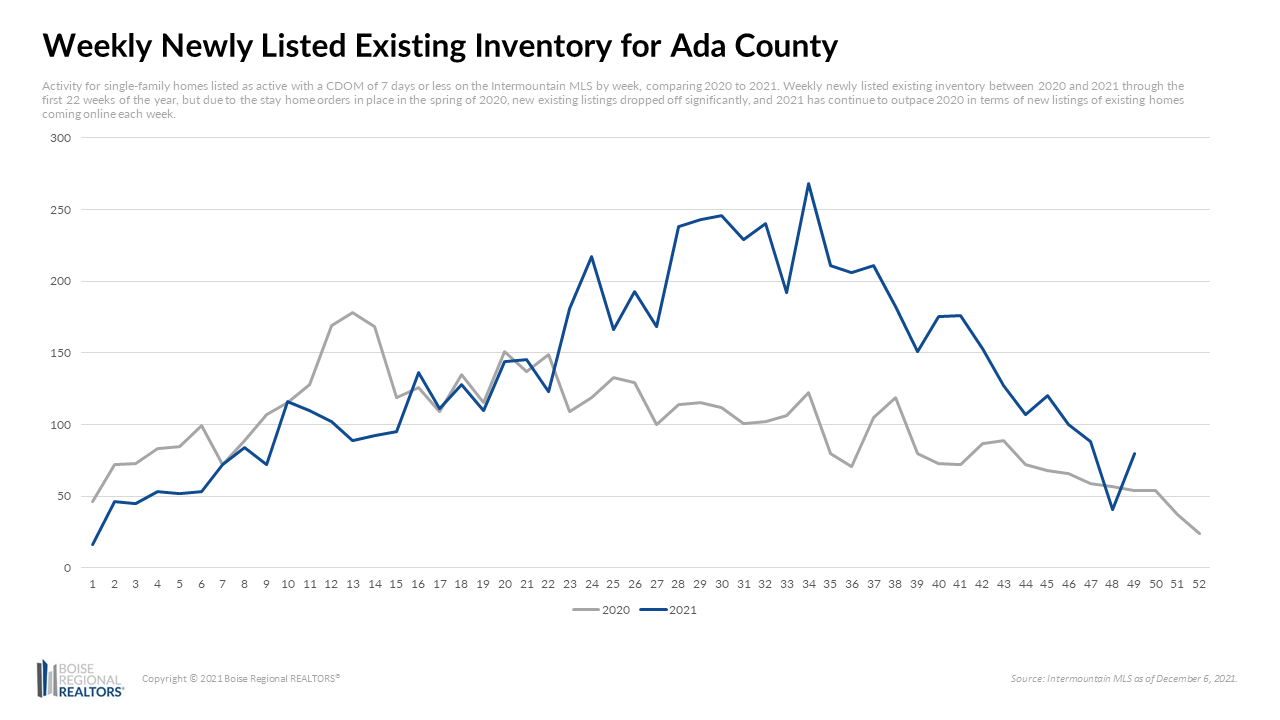
Existing inventory levels continue to increase in Ada County. There were 80 existing homes that came on the market last week, a 48.1% increase compared to the 54 existing the same week a year ago. Weekly newly listed existing inventory (active status with a cumulative days on the market of 7 days or less) were comparable between 2020 and 2021 through the first 22 weeks of the year, but due to the stay at home orders in place in the spring of 2020, new existing listings dropped off significantly, and 2021 has continued to outpace 2020 in terms of new listings of existing homes coming online each week. Last week’s uptick in existing inventory indicates sellers are ready to list, even into the winter months.
Data from the Intermountain MLS for the week ending on 12/5/21.
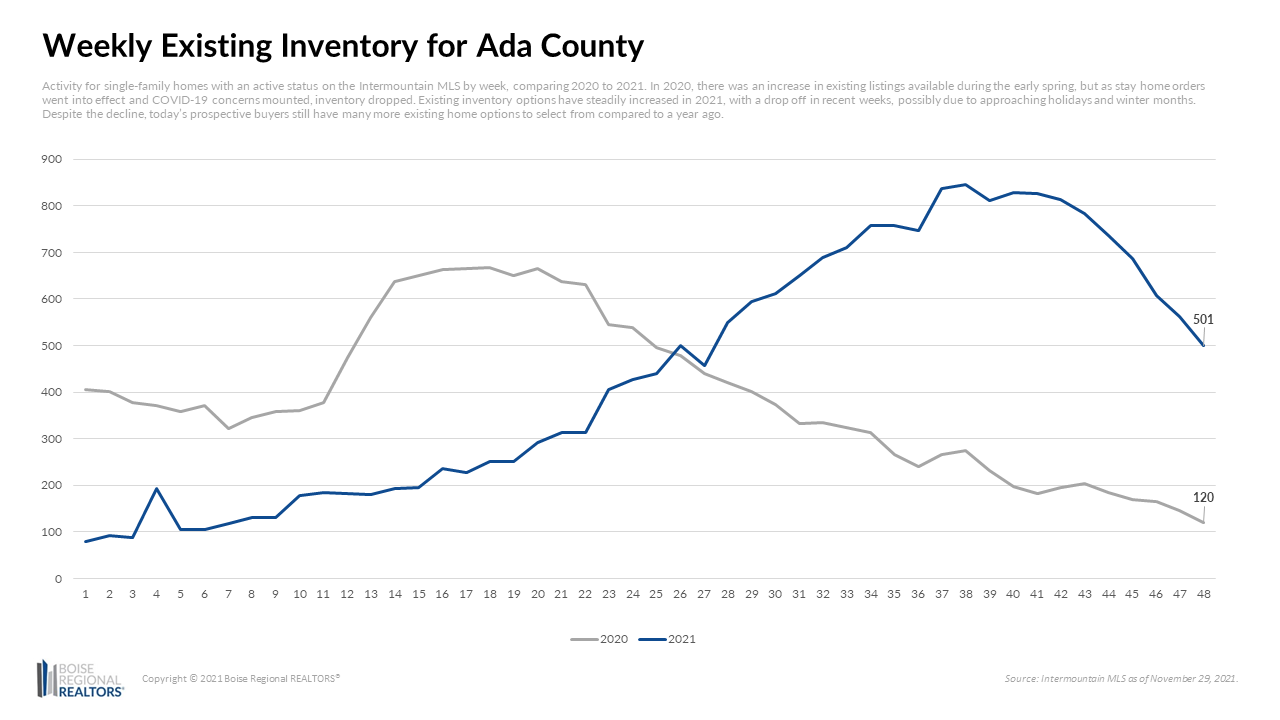
In 2020, there was an increase in existing listings available during the early spring, but as stay home orders went into effect and COVID-19 concerns mounted, inventory dropped. Existing inventory options have steadily increased in 2021, with a drop off in recent weeks, possibly due to approaching holidays and winter months. Despite the decline, with 501 available existing listings, today’s prospective buyers have many more options to select from compared to a year ago.
Data from the Intermountain MLS for the week ending on 11/28/21.
24
Days on the Market
Existing homes in Ada County that closed last week spent an average of 24 days on the market (DOM) before going under contract. This is an increase of 351.8% compared to the same week last year when DOM for existing homes was five days. Market times for existing homes have slowed since late July 2021, and this last week has been the longest DOM we’ve seen yet this year.
Data from the Intermountain MLS for the week ending on 11/21/21.




2 Comments