NEW CONSTRUCTION HOME SALES AND MEDIAN HOME PRICES CONTINUE TO CLIMB IN ADA COUNTY
Key Takeaways:
- New construction sales are gaining more and more of the market share and continuing to influence the overall median sales price.
- In the existing home segment, the median sales price has been rising due to a persistent lack of supply, especially in the lower price points.
- An increased share of higher-priced existing homes has contributed to the higher median sales price reported for the existing home segment.
New Construction’s Impact on the Overall Market
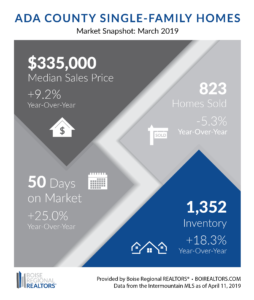
As reported last month, new construction sales are gaining more and more of the total market share in Ada County. Since new homes generally sell for more than existing homes, new home sales continue to have a greater impact on the overall median sales price. In February 2019, new construction sales made up 38.7% of all home sales in Ada County. In March 2019, that share increased to 39.8% resulting in an overall median sales price of $335,000, an increase of 8.4% year-over-year and a record high for Ada County.
Existing Home Prices Up Due to Lack of Lower-Priced Inventory
In the existing home segment, the median sales price has been rising due to a persistent lack of supply, especially in the lower price points. This pushed the median sales price for existing homes in Ada County to $309,900 in March 2019, an increase of 6.9% year-over-year and a record high for the county.
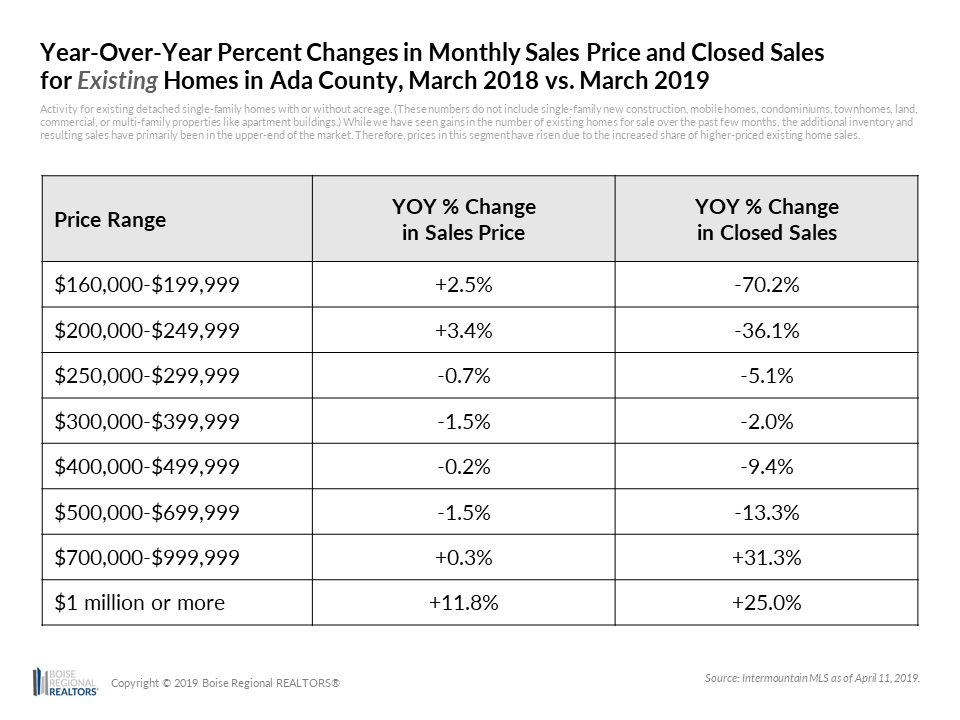
While we have seen gains in the number of existing homes for sale over the past few months, the additional inventory and resulting sales have primarily been in the upper-end of the market:
As with new construction’s impact on the overall market, the increased share of higher-priced existing homes has contributed to the higher median sales price reported for the existing home segment.
Where do Condo and Townhomes Fit In?
Traditionally BRR has not reported on the condo/townhome segment, due to the very small market share it represents (less than 10% of the sales and inventory). However, the smaller footprint and shared land costs provide an average list price that’s about 8-9% less than that of single-family homes. While there are not as many condos or townhomes to look at, and there may be costs beyond the purchase price, such as homeowners’ association fees, these could be an option for some buyers.
We’re seeing some shifting dynamics in our local market with the increase in new construction sales and higher-priced existing home sales. However, this doesn’t mean that there still are not affordable options for those who are looking. Now is the time to talk to your REALTOR® about your options.
HOME SALES AND PRICES CONTINUE TO RISE IN ELMORE COUNTY
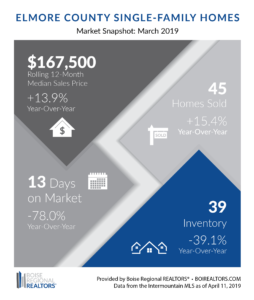
The median sales price for homes in Elmore County reached $167,500 in March 2019, an increase of 13.9% compared to the same time last year. Due to the smaller number of transactions that occur in the area, we use a rolling 12-month median sales price, to get a better idea of the overall trends.
This price increase was due in part to more homes being sold at overall higher price points. In March, there were 45 closed sales in Elmore County, up 15.4% from March 2018.
Additionally, buyer demand has continued to outpace supply, putting even more pressure on home prices. In March 2019, the Months Supply of Inventory in Elmore County was at just 0.8 months — down 60.0% from the same month last year.
The Months Supply of Inventory metric (or MSI) measures the relationship between pending sales (which measures buyer demand) and inventory (which measures supply). A balanced market—not favoring buyers or sellers—is typically when MSI is between 4-6 months of supply. MSI below four months is usually more favorable to sellers, while MSI above six months is usually more favorable to buyers.
We will continue to monitor how the new construction segment impacts the median sales price, but for those looking to buy or sell, talking to a REALTOR® is the best way to get information about market trends specific to your situation.
HOME SALES AND PRICES UP IN GEM COUNTY
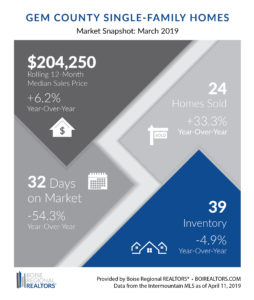
In March 2019, 24 homes sold in Gem County, up 33.0% from March 2018. This left 39 new and existing/resale homes available for sale at the end of the month, down 4.9% from a year ago.
Pending sales (or homes under contract) measures buyer demand, while inventory (or homes for sale) measures supply. The relationship between these two metrics is reported as Months Supply of Inventory (or MSI), which was at 1.9 months in March 2019.
A balanced market—not favoring buyers or sellers—is typically when MSI is between 4-6 months of supply. MSI below four months is usually more favorable to sellers, while MSI above six months is usually more favorable to buyers.
Gem County has had persistently low existing/resale inventory for the last several years, resulting in buyer demand outpacing supply, as shown through the low MSI calculation. This, in turn, has caused home prices to rise in Gem County.
Based on the rolling median data between March 2018 and March 2019, the median sales price for Gem County was $204,250, an increase of 6.2% over the same period last year. We use a rolling 12-month median sales price, to get a better idea of the overall trends due to the smaller number of transactions that occur in the area.
As buyer demand continues to grow, so too will the price of homes in Gem County. If you are considering a move—whether buying or selling— talk to a REALTOR® as they can help you determine what’s right for you
RESOURCES:
Additional information about trends within the Boise Region, by price point, by existing and new construction, and by neighborhood, are now available here: Ada County, Elmore County, Gem County, and City Data Market Reports. Each includes an explanation of the metrics and notes on data sources and methodology.
Download the latest (print quality) market snapshot graphics for Ada County, Ada County Existing/Resale, Ada County New Construction, Elmore County and Gem County.
# # #
This report is provided by Boise Regional REALTORS® (BRR), a 501(c)(6) trade association, representing real estate professionals throughout the Boise region. Established in 1920, BRR is the largest local REALTOR® association in the state of Idaho, helping members achieve real estate success through ethics, professionalism, and connections. BRR has two wholly-owned subsidiaries, Intermountain MLS (IMLS) and the REALTORS® Community Foundation.
If you have questions about this report, please contact Annie Exline, Communications Specialist for Boise Regional REALTORS®. If you are a consumer, please contact a REALTOR® to get the most current and accurate information specific to your situation.
The data reported is based primarily on the public statistics provided by the IMLS. These statistics are based upon information secured by the agent from the owner or their representative. The accuracy of this information, while deemed reliable, has not been verified and is not guaranteed. These statistics are not intended to represent the total number of properties sold in the counties or cities during the specified time period. The IMLS and BRR provide these statistics for purposes of general market analysis but make no representations as to past or future performance. The term “single-family homes” includes detached single-family homes with or without acreage, as classified in the IMLS. These numbers do not include activity for mobile homes, condominiums, townhomes, land, commercial, or multi-family properties (like apartment buildings).


