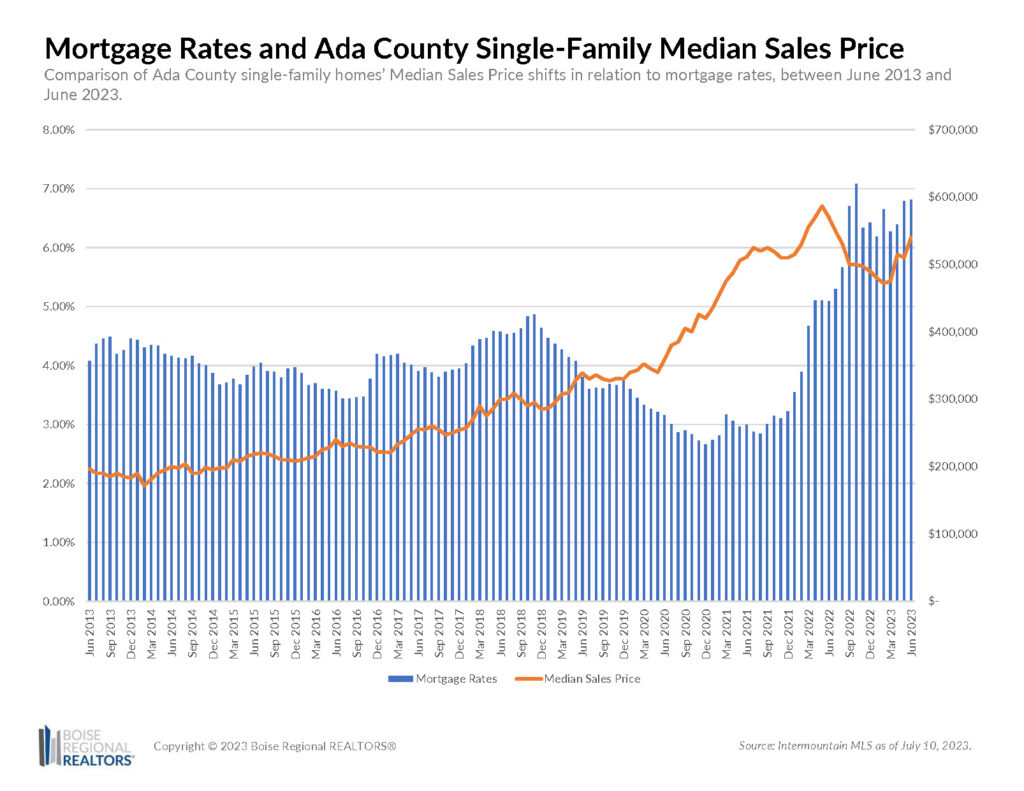
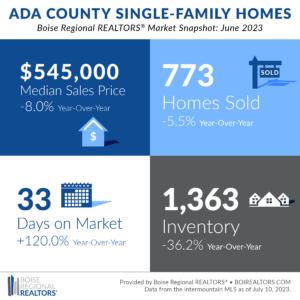
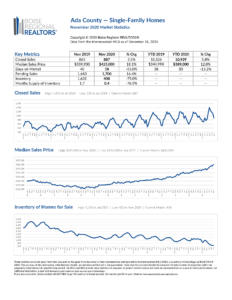
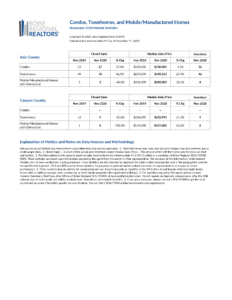
The median sales price in Ada County for June 2023 was $545,000, an 8.0% cut from the same month a year ago but the third consecutive bump up compared to the month preceding. The existing/resale sector remains cooler at $540,000, but still an uptick of $30,000 from May 2023. New construction saw the only month-over-month decrease of approximately $49,000 for a total median sales price of $557,500.
Affordability continues to be shadowed by supply versus demand. However, with pressures from increasing rent prices for two-bedroom homes (according to Rent.com), consumers are looking for workarounds to get into homeownership. Tools such as NAR & Apartment Therapy’s “Real [Estate] Talk” interactive hub and IHFA’s rental assistance programs are helping renters explore their options toward ownership.
Owning a home goes beyond protecting yourself from the mercy of a landlord. Homeownership is a long-term investment that can help you build your overall wealth portfolio. According to recent data released by NAR, middle-income homeowners compounded their wealth by upwards of $120,000 over ten years.
Mortgage applications have been up for three consecutive weeks, showing forward motion for the market. Shrinking inventory may drive prices higher while mortgage rates (currently at 6.81%) urge reprieve from the three-month climb.
There are currently 1,363 homes available in Ada County — 811 existing/resale homes and 552 new builds. This is the fourth month of positive month-over-month trends for single family homes but comes up 36.2% short compared to June 2022.
Single family homes in Ada County are currently going under contract in an average of 33 days, a stark difference from the 10 days we saw last year but more on-par with days on market from before COVID.
Sales were up for all three sectors for a total of 773 sales for the month — broken down to 553 resale homes and 220 new construction homes. June 2023 showed a 5.5% deficit in sales compared to June 2022. Historically, June typically experiences around double the sales that this year has shown.
In addition to pinched affordability, the “Great Relocation” may be a contributing factor for the sluggish season. In the fourth quarter of 2020, owner-occupied households increased by an estimated 2.1 million in a year. Typically, owners spend approximately 13.2 years in their homes, meaning the uptick in purchases may result in a lag for future purchases moving forward.
Buyers are patiently waiting for more options to become available while sellers are hesitant to abandon their attractive interest rates from purchases during the pandemic. It’s important to remember, however, that interest rates can be bought down with the cash equity from your current home if moving is in the cards for you. A REALTOR® can help you find the best solution for your needs.
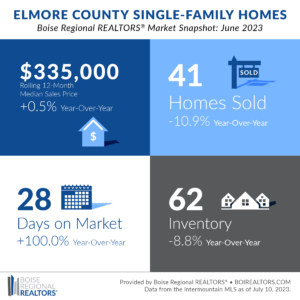
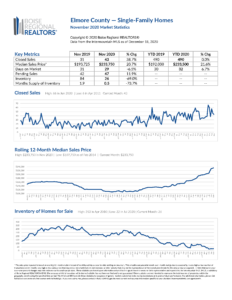
The rolling 12-month median sales price for Elmore County home sales was $335,000 in June 2023, 0.5% boost from June 2022 but a $5,000 slide from last month. Due to the smaller number of transactions that occur in the area, we use a rolling 12-month median sales price to get a better idea of the overall trends. June was the closest we’ve seen to a price decrease in 14 weeks.
Elmore County was the only county in BRR’s orbit to see year-over-year growth for pending contracts, up by 7.8% for a total of 55 pending sales for single-family homes. The breakdown between sectors showed a 7.1% droop in resale pendings and 77.8% lift in new construction activity.
New construction listings spent more than double the amount of time on the market than existing homes in June. Up 71.4% from last year, new builds went under contract an average of 60 days after hitting the market. Existing homes were swept away much quicker at only 26 days. An important piece to note is that builders are now (once again) placing To Be Built properties in the MLS, sometimes months ahead of the completion date. This is reflected in the longer days on market for new construction.
The quick pace for existing homes may pose concern for inventory which saw its first year-over-year decline in 17 weeks — down to 48 available homes. The slim availability brought resale homes’ months’ supply of inventory down to 1.4 in June which is just .1 higher than last year. New construction remains the closest to a “balanced market” (a market with a supply of 4-6 months that doesn’t favor buyers or sellers), coming in at 3.8 MSI. Many sellers are hesitant to abandon their current interest rate to purchase a new home.
Buyers are patiently waiting for more options to become available while sellers are hesitant to abandon their attractive interest rates from purchases during the pandemic. It’s important to remember, however, that interest rates can be bought down with the cash equity from your current home if moving is in the cards for you. A REALTOR® can help you find the best solution for your needs.
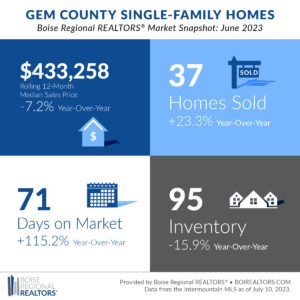
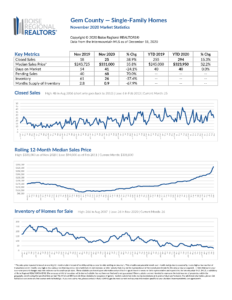
The rolling 12-month median sales price for Gem County home sales was $433,258 in June 2023, a 7.2% decrease from the year before but mirror image of last month. Due to the smaller number of transactions that occur in the area, we use a rolling 12-month median sales price to get a better idea of the overall trends. June followed a three-month trend in sales price cuts, contrasted with the consistent increases we’d seen between May 2016 and March 2023.
While median sales prices have taken a nap, average list prices have agitated. The $510,179 average listing price wakened by $20,000 compared to the month before but snoozed by about $29,000 year-over-year. We may see those listings come down a touch in price as pending contracts have shrunk in June 2023 by 32.7% from June 2022 for a total of 35 pending sales.
Homes in Gem County are taking longer to get into pending status, averaging at 71 days on market before going under contract. This is the second month of stretched market times, up 19 days from May 2023. Existing/resale homes are experiencing approximately half the waiting period of all single-family homes at 36 days while new construction came in at 145 days for the month. An important piece to note is that builders are now (once again) placing To Be Built properties in the MLS, sometimes months ahead of the completion date. This is reflected in the longer days on market for new construction.
A potential factor for the change in market could be the number of options available for purchasers to choose from. June presented 95 available single-family homes — 62 resale homes and 33 new construction homes — a 15.9% reduction from last June’s options and the first downward year-over-year trend we’ve seen since April 2021. The reason for the shortage could be that sellers are weary of stepping into more recent interest rates to purchase a new home.
Buyers are patiently waiting for more options to become available while sellers are hesitant to abandon their attractive interest rates from purchases during the pandemic. It’s important to remember, however, that interest rates can be bought down with the cash equity from your current home if moving is in the cards for you. A REALTOR® can help you find the best solution for your needs.
While supply remains drained, Gem’s sales in June were up by 23.3% compared to June 2022 (the first positive swing in four months), likely a reflection of the influx of pending sales we saw last month that would have closed this month.
Additional information about trends within the Boise Region, by price point, by existing and new construction, and by neighborhood, are now available here: Ada County, Elmore County, Gem County, and Condos, Townhouses, and Mobile/Manufactured Homes Market Reports. Each includes an explanation of the metrics and notes on data sources and methodology.
Download the latest (print quality) market snapshot graphics for Ada County, Ada County Existing/Resale, Ada County New Construction, Elmore County, and Gem County. Since Canyon County is not part of BRR’s jurisdiction, we don’t publicly report on Canyon County market trends. Members can access Canyon County snapshots and reports in the Market Report email, or login to our Market Statistics page. Boise and Owyhee County snapshots can also be accessed on our Market Statistics page.
# # #
The data reported is based primarily on the public statistics provided by the Intermountain MLS (IMLS), a subsidiary of Boise Regional REALTORS® (BRR). These statistics are based upon information secured by the agent from the owner or their representative. The accuracy of this information, while deemed reliable, has not been verified and is not guaranteed. These statistics are not intended to represent the total number of properties sold in the counties or cities during the specified time period. The IMLS and BRR provide these statistics for purposes of general market analysis but make no representations as to past or future performance. If you have questions about this report, please contact BRR’s Director of Communications Taylor Gray at 208-947-7238. For notes on data sources, methodology, and explanation of metrics, visit boirealtors.com/notes-on-data-sources-and-methodology.
If you are a consumer, please contact a REALTOR® to get the most current and accurate information specific to your situation.
Boise Regional REALTORS® (BRR), a 501(c)(6) trade association, represents real estate professionals throughout the Boise region. Established in 1920, BRR is the largest local REALTOR® association in the state of Idaho, helping members achieve real estate success through ethics, professionalism, and connections. BRR has two wholly-owned subsidiaries, Intermountain MLS (IMLS) and the REALTORS® Community Foundation.
“REALTOR®” is a federally registered collective membership mark which identifies a real estate professional who is member of the National Association of REALTORS® (NAR) and subscribes to its strict Code of Ethics.

