MEDIAN SALES PRICE OF ADA COUNTY HOMES DROPS (SLIGHTLY) IN JULY
Key Takeaways:
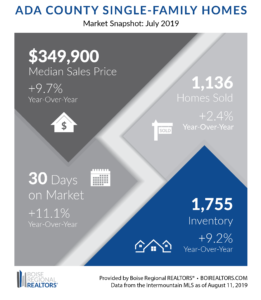
- The median sales price was at $349,900 in July 2019 for Ada County, an increase of 9.7% compared to last year, but down 1.3% from June 2019.
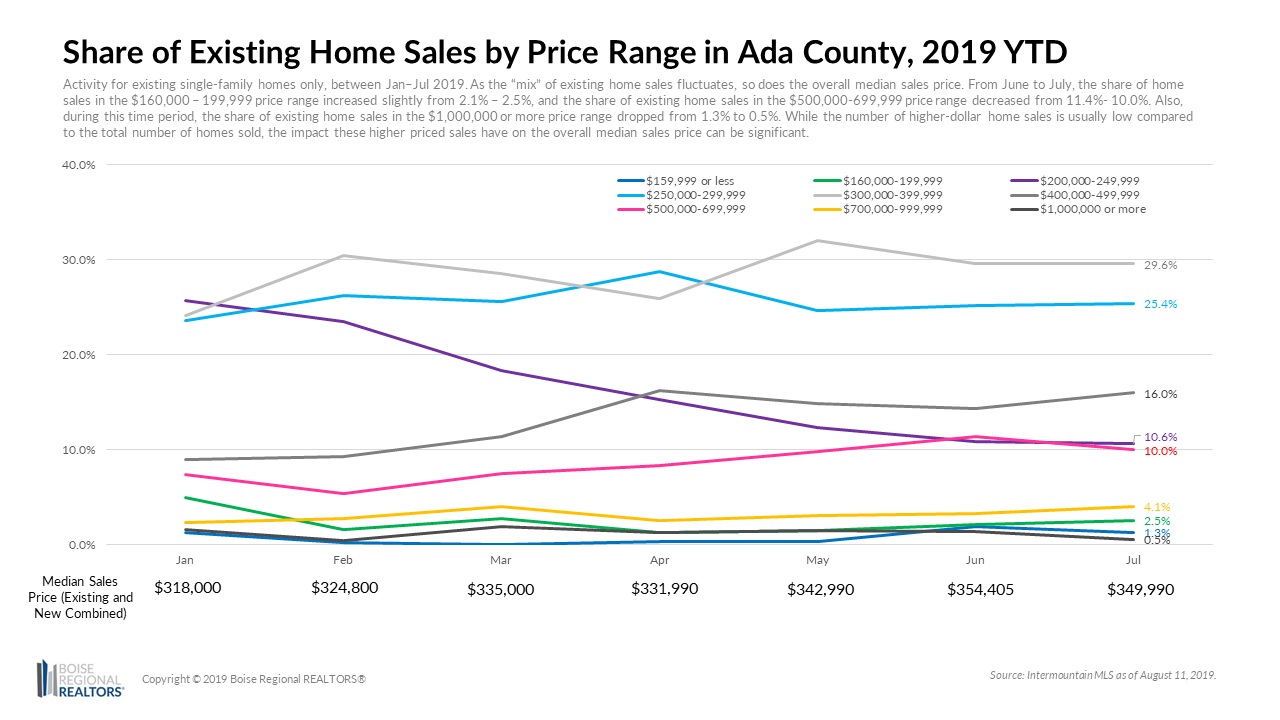
- One reason we’re seeing month-to-month price fluctuations is changes to the “mix” of existing home sales by price range.
- The year-over-year price gains continue to be driven by more demand than supply. Months Supply of Inventory (MSI) in July 2019 was at 1.9 months, up 13.9% from 1.7 months in July 2018.
Analysis:
In July, there were 1,136 closed home sales and 1,741 homes that went under contract, or “pending”. Both closed sales and pending metrics were up compared to July of 2018, 2.4% and 2.5% year-over-year, respectively. Despite an uptick in sales activity, the median sales price was at $349,900 in July 2019 for Ada County, an increase of 9.7% compared to last year, but down 1.3% from June 2019.
Why the fluctuations in price? One reason is that as the share of existing sales by price range changes on a month by month basis, it results in a new “mix” of existing home sales and impacts the overall median sales price.

From June to July, the share of home sales in the $160,000 – 199,999 price range increased slightly from 2.1% – 2.5%, and the share of existing home sales in the $500,000-699,999 price range decreased from 11.4%- 10.0%. Also, during this time period, the share of existing home sales in the $1,000,000 or more price range dropped from 1.3% to 0.5%. While the number of higher-dollar home sales is usually low compared to the total number of homes sold, the impact these higher priced sales have on the overall median sales price can be significant.
The current “mix” of home sales is only made possible by the inventory that is available for purchase. We’ve seen increased inventory levels each month since April, with 1,755 homes available for sale at the end of July 2019, an increase of 9.2% from July of 2018. This additional inventory was welcome news as the metro area continues to experience persistently low inventory compared to demand.
While this helps explain the month-to-month decrease, the year-over-year price gains continue to be driven by more demand than supply. One of the metrics used to determine supply vs. demand is Months Supply of Inventory (or MSI). A balanced market—not favoring buyers or sellers—is typically between 4-6 months of supply. Months Supply of Inventory (MSI) in July 2019 was at 1.9 months, up 13.9% from 1.7 months in July 2018.
Despite the increase, July’s MSI is still well below the 4-6 month range that would indicate balanced market. As long as inventory remains far below demand from home buyers, we expect that prices will stay elevated with some month-to-month fluctuations based on the mix of sales and individual prices.
JULY 2019 ELMORE COUNTY HOUSING MARKET UPDATE
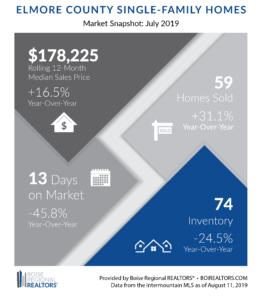
Elmore County home sales that closed in July flew off the market at record speed, spending only an average of 13 days on the market before going under contract. This was 45.8% faster than in July 2018 when the average days on market was 24.
The median sales price also set a record at $178,225; an increase of 16.5% compared to the same time last year. Due to the smaller number of transactions that occur in the area, we use a rolling 12-month median sales price to get a better idea of the overall trends. Prices continue to be driven home buyer demand and persistently low inventory.
Sales activity was also up in Elmore County in July with 59 closed home sales and 69 homes going under contract, or “pending” — increases of 31.1% and 21.1% respectively, from the year before.
There was a slight uptick in the number of homes available for purchase at the end of the month, 74 in July compared to 69 in June. Despite this increase, July marked 54 months of consecutive year-over-year declines in inventory. Months Supply of Inventory in Elmore County was at 1.8 months — down 28.0% from the same month last year.
The Months Supply Inventory (MSI) metric measures the relationship between pending sales (which measures buyer demand) and inventory (which measures supply). A balanced market— not favoring buyers or sellers — is typically when MSI is between 4-6 months of supply. MSI below four months is usually more favorable to sellers, while MSI above six months is usually more favorable to buyers.
JULY 2019 GEM COUNTY HOUSING MARKET UPDATE
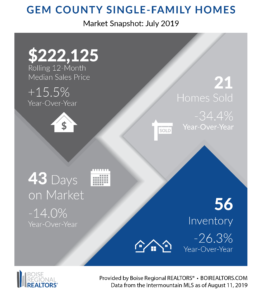
As of July 2019, the median sales price for Gem County was at $222,125, an increase of 15.5% over the same period last year, and a new record high for the county. We use a rolling 12-month median sales price to get a better idea of the overall trends due to the smaller number of transactions that occur in the area. Home prices have been driven by persistently low inventory versus demand.
There were 21 homes sales in July, down 34.4% from July 2018, and but up 16.7% from last month. Pending sales were also up, with 66 homes pending in July, up 1.5% from a year ago. This left 56 homes available for sale at the end of the month, down 26.3% year-over-year but up 12.0% from June 2019.
Pending sales (or homes under contract) measures buyer demand, while inventory (or homes for sale) measures supply. The relationship between these two metrics is reported as Months Supply of Inventory (or MSI), which was at 2.1 months in July 2019, down from 2.9 months a year ago.
A balanced market — not favoring buyers or sellers — is typically when MSI is between 4-6 months of supply. MSI below four months is usually more favorable to sellers, while MSI above six months is usually more favorable to buyers.
Sellers are enjoying record high prices in Gem County. If you’re considering a move, talk to your REALTOR® to learn more about the options available to you.
RESOURCES:
Additional information about trends within the Boise Region, by price point, by existing and new construction, and by neighborhood, are now available here: Ada County, Elmore County, Gem County, and City Data Market Reports. Each includes an explanation of the metrics and notes on data sources and methodology.


Download the latest (print quality) market snapshot graphics for Ada County, Ada County Existing/Resale, Ada County New Construction, Elmore County and Gem County. Since Canyon County is not part of BRR’s jurisdiction, we do report on Canyon County market trends. Members can access Canyon County snapshots and reports in the Market Report email, or reach out to us directly at cassie@boirealtors.com or annie@boirealtors.com.
# # #
This report is provided by Boise Regional REALTORS® (BRR), a 501(c)(6) trade association, representing real estate professionals throughout the Boise region. Established in 1920, BRR is the largest local REALTOR® association in the state of Idaho, helping members achieve real estate success through ethics, professionalism, and connections. BRR has two wholly-owned subsidiaries, Intermountain MLS (IMLS) and the REALTORS® Community Foundation.
If you have questions about this report, please contact Cassie Zimmerman, Director of Communications for Boise Regional REALTORS®. If you are a consumer, please contact a REALTOR® to get the most current and accurate information specific to your situation.
The data reported is based primarily on the public statistics provided by the IMLS. These statistics are based upon information secured by the agent from the owner or their representative. The accuracy of this information, while deemed reliable, has not been verified and is not guaranteed. These statistics are not intended to represent the total number of properties sold in the counties or cities during the specified time period. The IMLS and BRR provide these statistics for purposes of general market analysis but make no representations as to past or future performance. The term “single-family homes” includes detached single-family homes with or without acreage, as classified in the IMLS. These numbers do not include activity for mobile homes, condominiums, townhomes, land, commercial, or multi-family properties (like apartment buildings).


