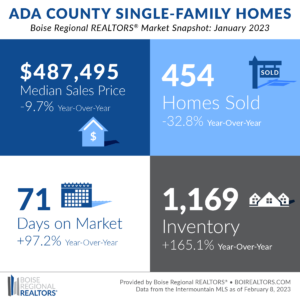
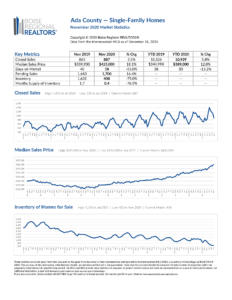
For the third consecutive month, the median sales price for homes in Ada County decreased year-over-year. In January, the median sales price of homes was $487,495 — down 9.7%, or $52,500, compared to January 2022. The last time that the overall median sales price was under $500,000 was in July 2021.
Both the existing/resale segment and new construction segment saw year-over-year declines in median sales price, with the biggest drop in new construction. The median sales price for new homes that closed in January was $494,990, a decrease of 16.0%, or $93,955, compared to the same month a year ago. The median sales price for new homes hasn’t been under $500,000 since April 2021.
Sales were also 32.8% lower for the county compared to last year, with a total of 454 closed sales in January 2023. Of those, 269 were existing/resale homes, down 41.5% from January 2022, and 185 were new construction homes, down 14.4% from last year.
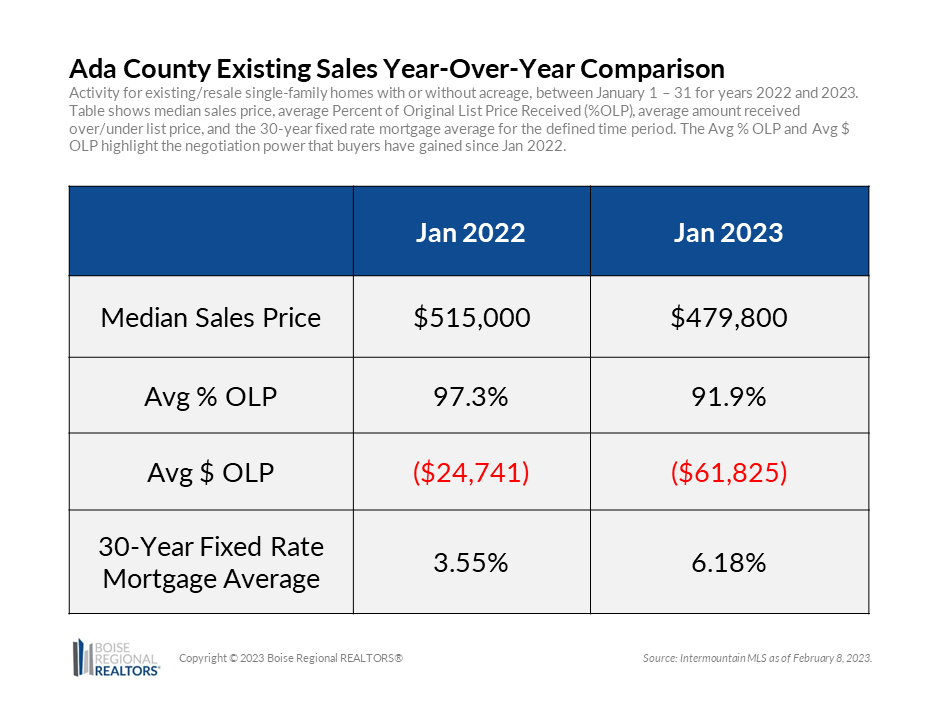
Demand for housing waned as higher mortgage interest rates and swift home price appreciation put pressure on affordability. Since the housing market continues to be driven by supply versus demand, sellers are having to adjust prices and negotiate with buyers to close the deal. The average Percent of Original List Price (% OLP) Received for existing home sales last month was 91.9%, which means on average, buyers paid 8.1% less than asking, compared to last year, when the % OLP for existing homes was 97.3%. On average, existing homes that closed last month sold for approximately $60,000 less than the original list price.
Will prices and sales continue their downward trend? Newly pending sales data, a forward looking metric, could indicate that demand bottomed out and is beginning to recover. For the last two weeks, we’ve seen new contract signings up year-over-year. We’ve also heard from members that they’ve experienced increased interest from both buyers and sellers. This uptick in activity, as well as the stabilization of mortgage interest rates, is a positive sign as we gear up for our spring market.
Today’s buyers have more negotiation power, more options to choose from, and more time to make a decision. There were 1,169 homes available on the market at the end of January, compared to 441 for the same month last year. This increase in supply is also putting downward pressure on home prices. Market times have slowed as well, and homes that closed last month spent an average of 71 days on the market before going under contract — nearly twice the average time that homes spent on the market in January 2022.
Those looking to sell their home in the coming months need to ensure their expectations are in line with what’s happening in the market. The days of a listing going under contract in a matter of hours for well over asking price are over. You may receive multiple offers, but it’s less likely that you’ll receive more than asking. Work closely with your real estate agent on your pricing and marketing strategy in order reach your goals.
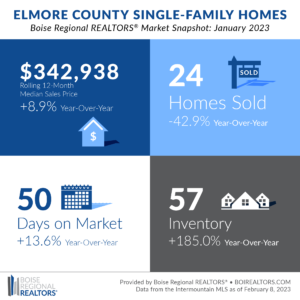
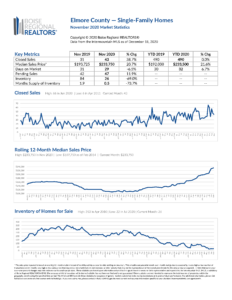
The rolling 12-month median sales price for Elmore County home sales was $342,938 in January 2023, an 8.9% increase from the year before. Due to the smaller number of transactions that occur in the area, we use a rolling 12-month median sales price to get a better idea of the overall trends. While price growth is still positive year-over-year, it has slowed from the double-digit increases we saw a few months ago.
Demand for housing waned as higher mortgage interest rates and home prices put pressure on affordability, resulting in fewer home sales. With 24 closings last month, the number of home sales decreased 42.9% compared to the same month a year ago. Of those, 17 were existing/resale homes and seven were newly constructed homes. There were 30 pending sales — properties with an accepted offer that are expected to close within 30-60 days — a decrease of 45.5% compared to January 2022, marking 11 consecutive months of year-over-year declines.
Today’s buyers have more options to choose from, and more time to make a decision. There were 57 available homes for purchase at the end of the month, an increase of 185.0% compared to January 2022. Of those, 46 were existing/resale listings and 11 were new homes. Market times have slowed as well, and homes that closed last month spent an average of 50 days on the market before going under contract, compared to 44 days a year ago.
Those looking to sell their home in the coming months need to ensure their expectations are in line with what’s happening in the market. The days of a listing going under contract in a matter of hours for well over asking price are over. You may receive multiple offers, but it’s less likely that you’ll receive more than asking. Work closely with your real estate agent on your pricing and marketing strategy in order reach your goals.
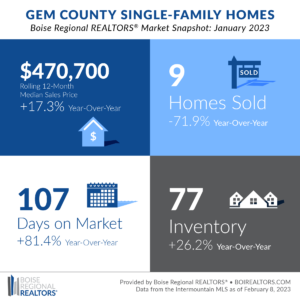
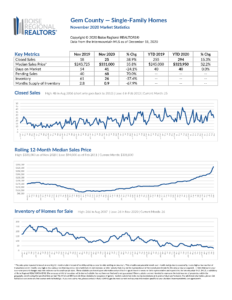
The rolling 12-month median sales price for Gem County home sales was $470,700 in January 2023, an 17.3% increase from the year before. Due to the smaller number of transactions that occur in the area, we use a rolling 12-month median sales price to get a better idea of the overall trends. While price growth is still positive year-over-year, it has slowed some from recent months.
Demand for housing waned as higher mortgage interest rates and home prices put pressure on affordability, resulting in fewer home sales. With nine closings last month, the number of home sales decreased 71.9% compared to the same month a year ago. Of those, three were existing/resale homes and six were newly constructed homes. There were 42 pending sales — properties with an accepted offer that are expected to close within 30-60 days — a decrease of 10.6% compared to January 2022, marking 18 consecutive months of year-over-year declines.
Today’s buyers have more options to choose from, and more time to make a decision. There were 77 available homes for purchase at the end of the month, an increase of 26.2% compared to January 2022. Of those, 40 were existing/resale listings and 37 were new homes. Market times have slowed as well, and homes that closed last month spent an average of 107 days on the market before going under contract, compared to 59 days a year ago.
Those looking to sell their home in the coming months need to ensure their expectations are in line with what’s happening in the market. The days of a listing going under contract in a matter of hours for well over asking price are over. You may receive multiple offers, but it’s less likely that you’ll receive more than asking. Work closely with your real estate agent on your pricing and marketing strategy in order reach your goals.
Additional information about trends within the Boise Region, by price point, by existing and new construction, and by neighborhood, are now available here: Ada County, Elmore County, Gem County, and Condos, Townhouses, and Mobile/Manufactured Homes Market Reports. Each includes an explanation of the metrics and notes on data sources and methodology.
Download the latest (print quality) market snapshot graphics for Ada County, Ada County Existing/Resale, Ada County New Construction, Elmore County, and Gem County. Since Canyon County is not part of BRR’s jurisdiction, we don’t publicly report on Canyon County market trends. Members can access Canyon County snapshots and reports in the Market Report email, or login to our Market Statistics page. Boise and Owyhee County snapshots can also be accessed on our Market Statistics page.
# # #
The data reported is based primarily on the public statistics provided by the Intermountain MLS (IMLS), a subsidiary of Boise Regional REALTORS® (BRR). These statistics are based upon information secured by the agent from the owner or their representative. The accuracy of this information, while deemed reliable, has not been verified and is not guaranteed. These statistics are not intended to represent the total number of properties sold in the counties or cities during the specified time period. The IMLS and BRR provide these statistics for purposes of general market analysis but make no representations as to past or future performance. If you have questions about this report, please contact BRR’s Director of Communications Taylor Gray at 208-947-7238. For notes on data sources, methodology, and explanation of metrics, visit boirealtors.com/notes-on-data-sources-and-methodology.
If you are a consumer, please contact a REALTOR® to get the most current and accurate information specific to your situation.
Boise Regional REALTORS® (BRR), a 501(c)(6) trade association, represents real estate professionals throughout the Boise region. Established in 1920, BRR is the largest local REALTOR® association in the state of Idaho, helping members achieve real estate success through ethics, professionalism, and connections. BRR has two wholly-owned subsidiaries, Intermountain MLS (IMLS) and the REALTORS® Community Foundation.
“REALTOR®” is a federally registered collective membership mark which identifies a real estate professional who is member of the National Association of REALTORS® (NAR) and subscribes to its strict Code of Ethics.

