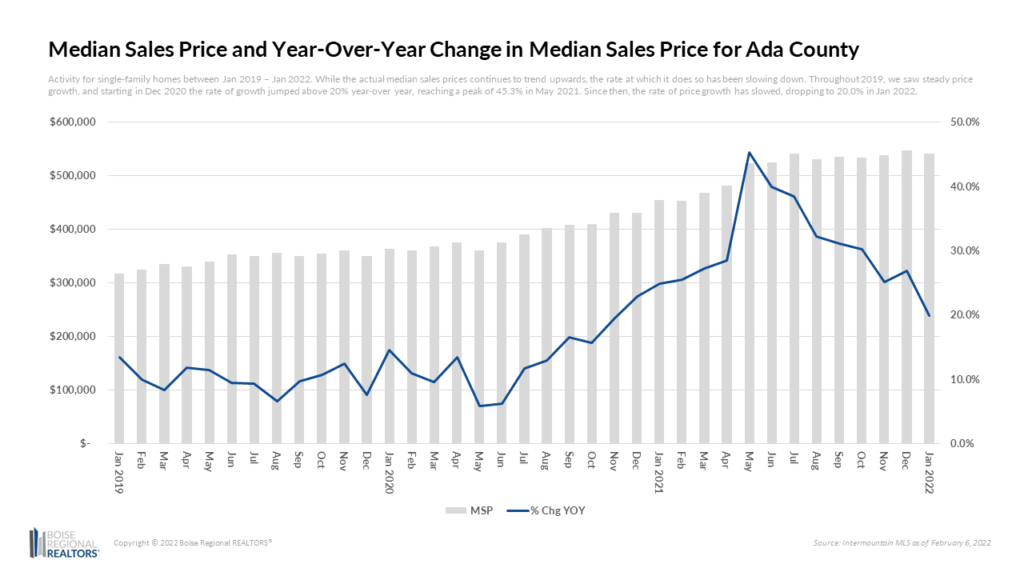
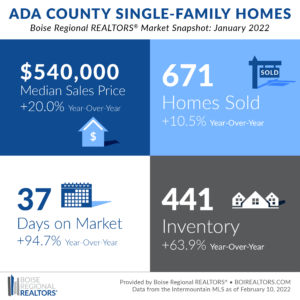
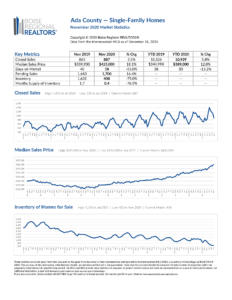
In January 2022, the median sales price for homes in Ada County was $540,000, an increase of 20.0% compared to January 2021, but a slight decrease of 1.1% from the month before.
While the actual median sales price continues to trend upwards, the rate at which it does so has been slowing in recent months. Throughout 2019, we saw fairly steady price growth, and in December 2020, it jumped above 20% year-over year, reaching a peak of 45.3% in May 2021.
Since then, price growth has slowed, landing at 20.0% in January 2022 — by no means an insignificant year-over-year change, especially for prospective home sellers, but a welcome reprieve from the higher gains we saw last year, especially for prospective homebuyers.
Home price increases continued to be driven by insufficient supply compared to buyer demand — primarily fueled by population growth, migration trends, and increased purchase power due to historically low mortgage rates. The most recent uptick in demand came from people re-thinking how they live and work as a result of the pandemic, contributing to the competitive conditions that enabled the incredible price growth we’ve seen in the last year.
The metric used to illustrate the supply vs. demand relationship is Months Supply of Inventory (MSI), which takes the number of homes for sale divided by the average number of sales by month for the preceding 12 months. As of January 2022, Ada County was at just 0.3 months for existing homes and 1.0 month for new construction, meaning, if no additional homes were listed, the supply of homes would run out in a matter of weeks. A balanced market — not favoring buyers or sellers — is typically between 4-6 months of supply.
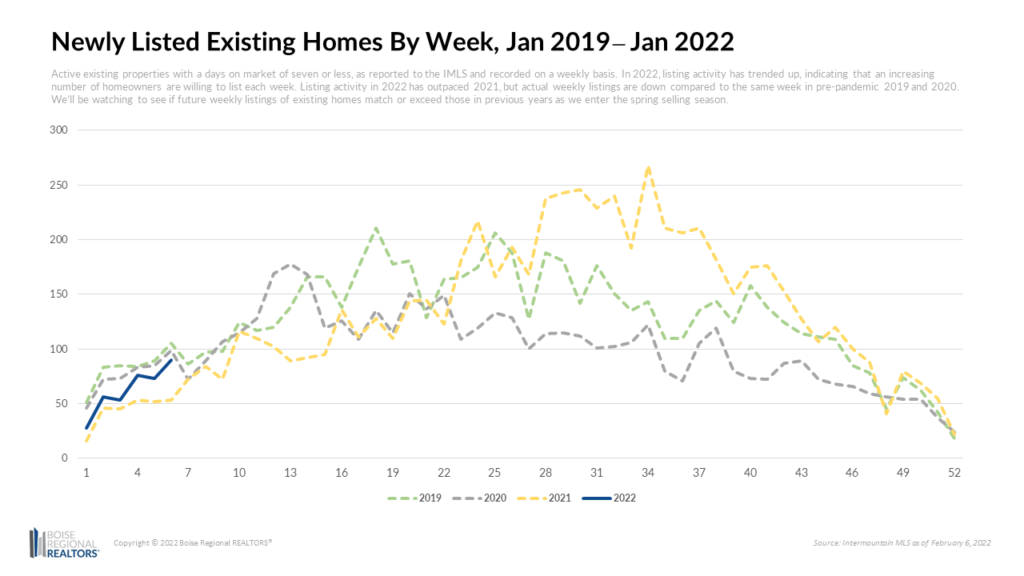
Even though buyer demand has been outpacing supply, weekly listing activity in 2022 has trended up, indicating that an increasing number of homeowners were ready to sell and cash in on the equity their homes have acquired over the last few years.
Listing activity in 2022 has so far been higher than the same period in 2021, but actual weekly listings were down compared to 2019 and pre-pandemic 2020. We’ll be watching to see if future weekly listings of existing homes match or exceed those in previous years.
With low, but increasing, inventory, will we continue to see the fast market pace and multiple offer scenarios experienced in 2021? We can’t say for sure, but so far Days on Market (DOM), the metric that measures the time between when a property is listed and when it has an accepted offer, has increased and normalized for existing homes.
Days on market for existing homes reached 33 days in January 2022, 18 days longer than in January 2021 and more in line with pre-pandemic levels in early 2020. This is good news for buyers as they may have a bit more time to make decisions and may not feel the need to waive contingencies when writing offers.
Additionally, the Percent of Original List Price Received for existing homes that sold in January 2022 was 97.3%, meaning that, on average, buyers paid less than asking through a lower accepted offer and/or seller concessions. In contrast, the Percent of Original List Price Received for existing home sales in January 2021 was 103.6%, indicating that, on average, buyers were paying more than asking price for homes.
It’s hard to say whether these longer, healthier market times were due to increasing prices, increasing mortgage rates, or some combination of the two. While competition may have begun ramping up again, one thing is for sure — our market needs more inventory in order to be more balanced. Homeowners who are considering selling are encouraged to talk to a REALTOR® right away to learn more about thier options. With the appreciation in home prices, there may be more equity than a seller might think.
Other notable statistics from January 2022:
- The median sales price for existing homes in January 2022 was $515,100, 18.4% higher than in January 2021. The median sales price for new construction in January 2022 was $588,945, 28.0% higher than a year ago.
- There were 441 homes available at the end of the month — 63.9% more than in January 2021 — although still very low compared to buyer demand.
- Of the 671 sales in the county, 457 were existing homes, an increase of 30.6% compared to the year prior. Overall sales (existing and new combined) were up 10.5% compared to January 2021.
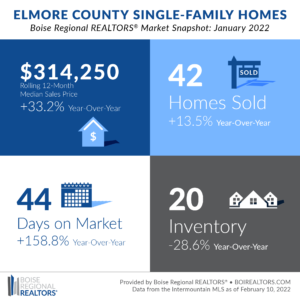
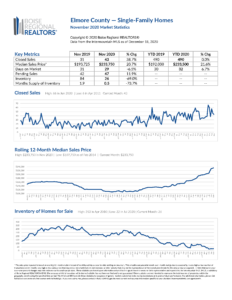
After a few months of year-over-year increases in inventory, listings dwindled again in January. With only 20 homes available for purchase at the end of the month, Elmore County is nearing historic lows when it comes to inventory.
The demand for homes continues to outpace the supply of homes for sale. The metric used to illustrate the supply vs. demand relationship is Months Supply of Inventory (MSI), which takes the number of homes for sale divided by the average number of sales by month for the preceding 12 months.
As of January 2022, Elmore County was at just 0.4 months, meaning, if no additional homes were listed, the supply of homes would run out in a matter of weeks. A balanced market — not favoring buyers or sellers — is typically between 4-6 months of supply.
There were 42 sales in the county, an increase of 13.5% compared to the same month last year. The median sales price was $314,250 in January 2022, a 33.2% increase from the year before. Due to the smaller number of transactions that occur in the area, we use a rolling 12-month median sales price to get a better idea of the overall trends.
For homeowners considering selling this spring, we encourage them to talk to a REALTOR® right away to understand their options and the potential equity they may have. Buyer demand is there, and any additional inventory would be positive for this market.
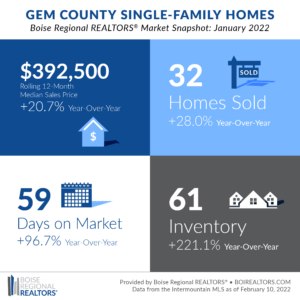
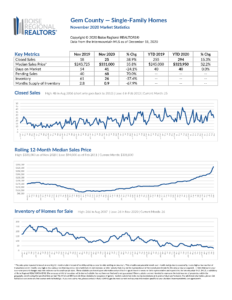
There were 32 homes that sold in January 2022, an increase of 28.0% compared to January 2021. Of those, 26 were existing sales while six were new construction.
Inventory was also up 221.1% compared to January 2021, and there were 61 homes available for purchase at the end of the month. While that triple digit increase may seem impressive, it’s worth noting that Gem County experienced a record low in inventory a year ago, with only 19 homes available for purchase at the end of January 2021.
Inventory is still low compared to buyer demand. This lack of supply compared to demand is driving up the median sales price, which reached $392,500 in January, 20.7% higher than a year ago.
Due to the smaller number of transactions that occur in the area, we use a rolling 12-month median sales price to get a better idea of the overall trends.
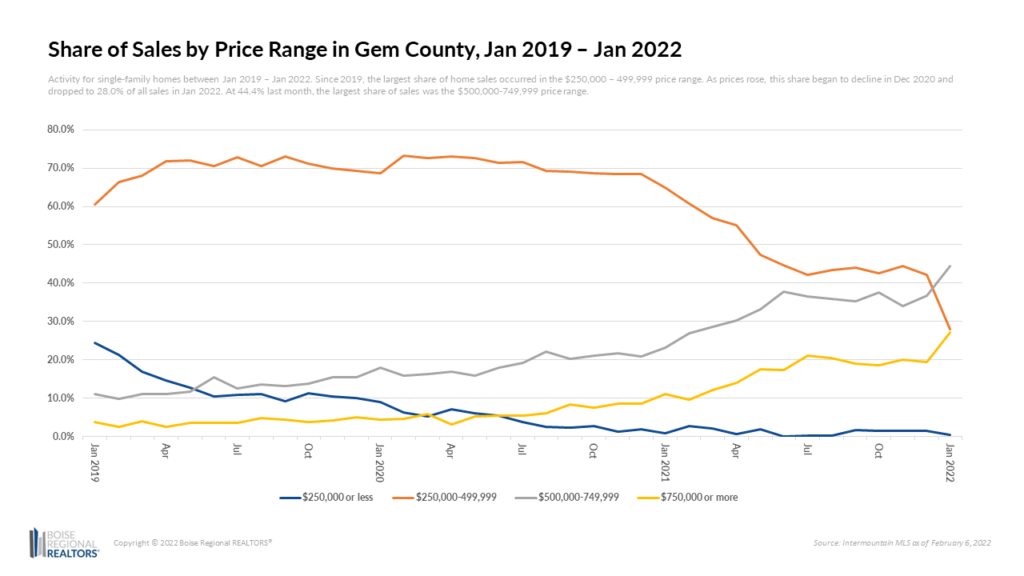
Looking at sales data by price range provides additional context to higher prices. Since 2019, the largest share of home sales occurred in the $250,000–499,999 price range. As prices rose, this share began to decline in December 2020 and dropped to 28.0% of all sales in January 2022. At 44.4% last month, the largest share of sales was in the $500,000-749,999 price range.
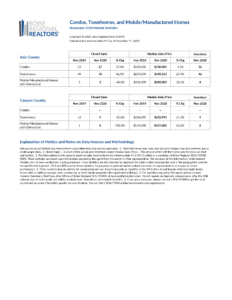
Additional information about trends within the Boise Region, by price point, by existing and new construction, and by neighborhood, are now available here: Ada County, Elmore County, Gem County, City Statistics, and Condos, Townhouses, and Mobile/Manufactured Homes Market Reports. Each includes an explanation of the metrics and notes on data sources and methodology.
Download the latest (print quality) market snapshot graphics for Ada County, Ada County Existing/Resale, Ada County New Construction, Elmore County, and Gem County. Since Canyon County is not part of BRR’s jurisdiction, we don’t publicly report on Canyon County market trends. Members can access Canyon County snapshots and reports in the Market Report email, or login to our Market Statistics page. Boise and Owyhee County snapshots can also be accessed on our Market Statistics page.
# # #
The data reported is based primarily on the public statistics provided by the Intermountain MLS (IMLS), a subsidiary of Boise Regional REALTORS® (BRR). These statistics are based upon information secured by the agent from the owner or their representative. The accuracy of this information, while deemed reliable, has not been verified and is not guaranteed. These statistics are not intended to represent the total number of properties sold in the counties or cities during the specified time period. The IMLS and BRR provide these statistics for purposes of general market analysis but make no representations as to past or future performance. If you have questions about this report, please contact Pete Clark, Director of Communications for Boise Regional REALTORS®. For notes on data sources, methodology, and explanation of metrics, visit boirealtors.com/notes-on-data-sources-and-methodology.
If you are a consumer, please contact a REALTOR® to get the most current and accurate information specific to your situation. For those seeking information on mortgage and rental assistance, including down payment programs, visit the Resources for Property Owners and Renters sections of BRR’s website.
Boise Regional REALTORS® (BRR), a 501(c)(6) trade association, represents real estate professionals throughout the Boise region. Established in 1920, BRR is the largest local REALTOR® association in the state of Idaho, helping members achieve real estate success through ethics, professionalism, and connections. BRR has two wholly-owned subsidiaries, Intermountain MLS (IMLS) and the REALTORS® Community Foundation.
“REALTOR®” is a federally registered collective membership mark which identifies a real estate professional who is member of the National Association of REALTORS® (NAR) and subscribes to its strict Code of Ethics.



1 Comment