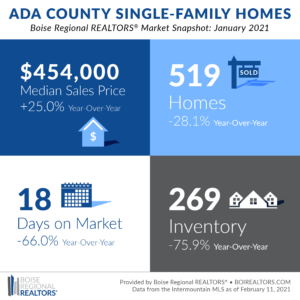
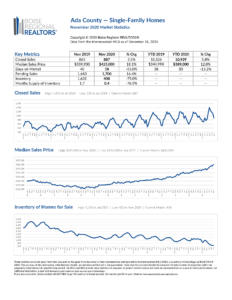
The first month of 2021 saw a continuation of 2020 trends — insufficient inventory compared to demand, faster market times than a year earlier, and persistently low mortgage rates — which combined, led to a new record median sales price of $454,000 in January.
Looking specifically at existing homes, the median sales price was at $443,500 in January, also a record, and an increase of 30.4% from last year. For many sellers, higher home prices usually mean greater equity, which can be used for another home purchase, to fund a business, send a child to college, or a variety of other opportunities.
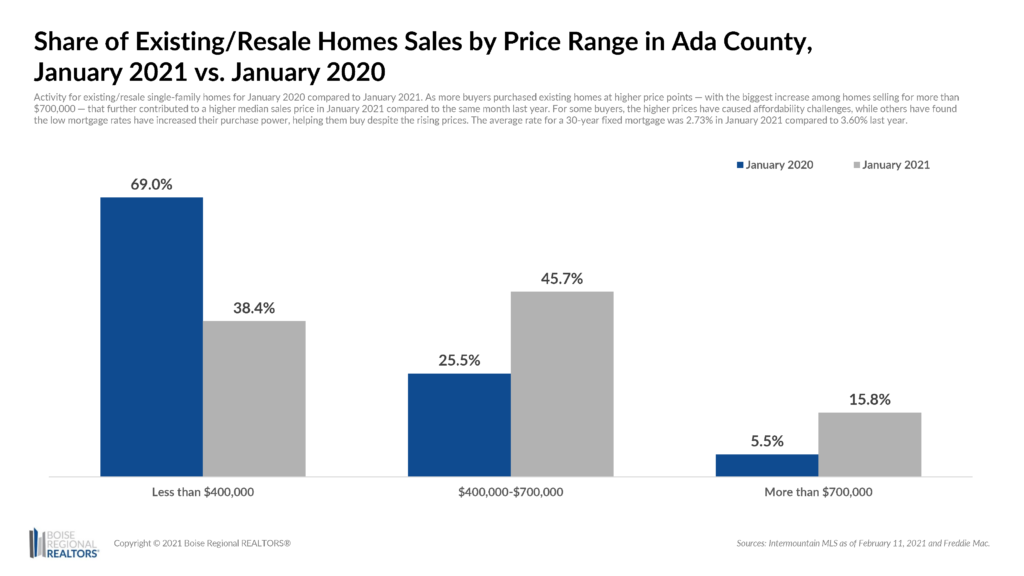
For some buyers, the higher prices have caused affordability challenges, while others have found the low mortgage rates have increased their purchase power, helping them buy despite the rising prices. The average rate for a 30-year fixed mortgage was 2.73% in January 2021 compared to 3.60% last year.
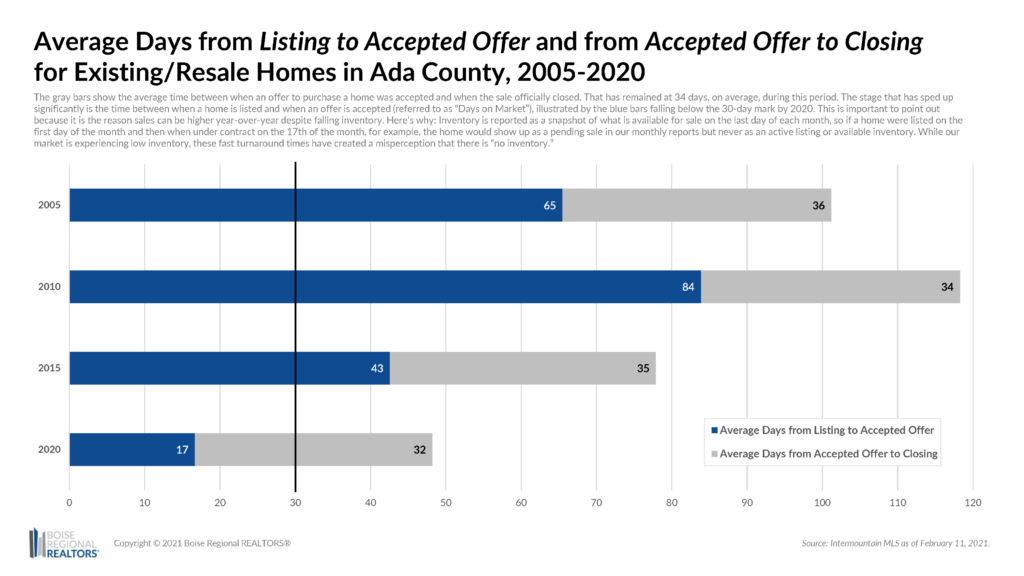
Most buyers and sellers have also experienced a competitive, fast-paced market where offers and decisions must be made quickly. To understand just how fast things have been moving, we looked at the average pace of existing home sales in Ada County over the last 15 years.
In the chart to the right, the gray bars show the average time between when an offer to purchase a home was accepted and when the sale officially closed. That has remained at 34 days, on average during this period, and is the stage in which the buyer and seller, with the help of their REALTOR®, lender, home inspector, and title company, work through the final mortgage approval, and any appraisals, home inspections, or repairs.
The stage that has sped up significantly is the time between when a home is listed and when an offer is accepted, as illustrated by the blue bars falling well below 30 days by 2020. This is important to point out because it is the reason sales can be higher year-over-year despite falling inventory. Here’s why: Inventory is reported as a snapshot of what is available for sale on the last day of each month, so if a home were listed on the first day of the month and then when under contract on the 17th of the month, the home would show up as a pending sale in our monthly reports but never as an active listing or available inventory. While our market is experiencing low inventory, these fast turnaround times have created a misperception that there is “no inventory.”
This acceleration has made the market feel frantic for many home buyers. In 2015, for example, after being listed a seller could expect to accept an offer in about 43 days, on average. Prior to then, they may have fielded multiple showings, had a few open houses, and had some buyers back for a second or third showing before receiving an offer. By 2020, that timeframe dropped to just 17 days, on average, meaning, if a buyer saw a home they liked, they may only have a few days, or hours even, to decide whether to make an offer as there were likely others interested.
In January 2021, that fell even further, as the average days on market for existing homes was at just 13 days — 66.7% faster than the same month last year.
To be competitive in these situations, many buyers have offered full list price or more, which is another reason the overall median sales price rose again. In January 2021, the percent of original list price received on existing home sales was 103.5%, compared to 97.2% in January 2020. This indicates that multiple offer situations are becoming more common, and buyers are willing to pay more to get an accepted offer. Among existing homes, the $400,000–$699,999 price range for existing homes was the most competitive, with the percent of original list price received reaching 104% or more, in January.
Also, as more buyers purchased existing homes at higher price points — with the biggest increase among homes selling for more than $700,000 — that further contributed to a higher median sales price in January. For example, in January 2020, just 5.5% of the existing homes that sold were for more than $700,000, compared to 15.8% in January 2021. This mix of homes sold had a significant impact in pushing up the overall median sales price for the county.
Market statistics are helpful indicators of the housing market overall, but what does the process of buying or selling look like for the individual?
In 2021, BRR will dig deeper into the various phases of a real estate transaction, to help consumers be prepared before, during, and after a real estate transaction, showing them what their REALTOR® will be doing for them along every step, and the key data points they can look for to make sense of the market.
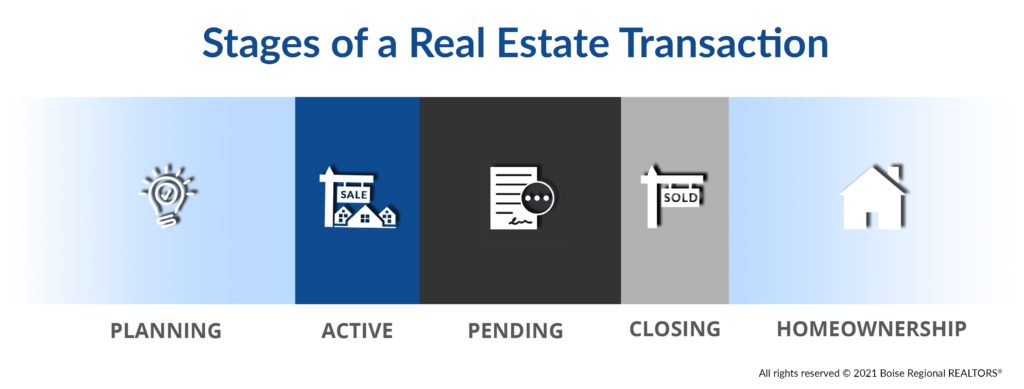
These two scenarios outlined above – faster market times and more off-market sales – make it imperative to work with a REALTOR®.
A REALTOR® provides buyers the advice and data needed to make informed decisions quickly and may be able to identify properties that are not yet on the market. Sellers find value in a REALTOR®’s ability to help evaluate multiple offers, oversee the negotiating process, as well as all the legal, financial, and administrative steps that come after the offer has been accepted in the pending stage. And for both groups, a REALTOR® can provide guidance in planning and preparing for a purchase or listing, long before any offers are accepted or for sale signs are put up.
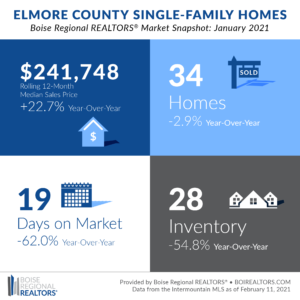
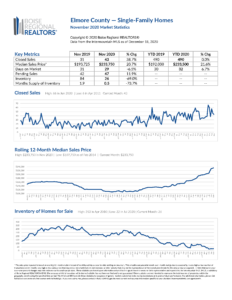
The first month of 2021 saw a continuation of 2020 trends — insufficient inventory compared to demand, faster market times than a year earlier, and persistently low mortgage rates — which combined, led to a median sales price of $241,748 in January, up 22.7% from the same month a year ago. Due to the smaller number of transactions that occur in the area, we use a rolling 12-month median sales price to get a better idea of the overall trends.
For many sellers, higher home prices usually mean greater equity, which can be used for another home purchase, to fund a new business, send a child to college, or a variety of other opportunities.
For some buyers, the higher prices have caused affordability challenges, while others have found the low mortgage rates have increased their purchase power, despite the rising prices. The average rate for a 30-year fixed mortgage was 2.73% in January 2021 compared to 3.60% last year.
The 34 homes in Elmore County that sold in January 2021 spent an average of 19 days on the market before going under contract, 62.0% faster than the 50-day average in January 2020. This resulted in a competitive, fast-paced market for buyers and sellers, where offers and decisions often had to be made quickly.
There were 28 homes available for purchase at the end of the month, down 54.8% compared to January 2020. The Elmore County housing market is experiencing low inventory, but these fast turnaround times have also created a misperception that there is “no inventory.” Inventory is reported as a snapshot of what is available for sale on the last day of each month, so if a home were listed on the first day of the month and then when under contract on the 19th, for example, the home would show up as a pending sale in our monthly reports but never as an active listing or available inventory.
Faster market times and low inventory make it imperative to work with a REALTOR®.
A REALTOR® provides buyers the advice and data needed to make informed decisions quickly and may be able to identify properties that are not yet on the market. Sellers find value in a REALTOR®’s ability to help them evaluate multiple offers, oversee the negotiating process, as well as all the legal, financial, and administrative steps that come after the offer has been accepted. And for both groups, a REALTOR® can provide guidance in planning and preparing for a purchase or listing, long before any offers are accepted or for sale signs are put up.
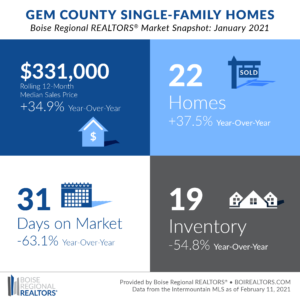
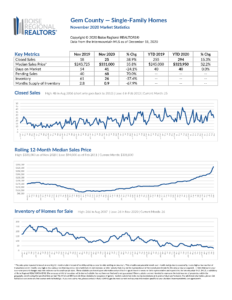
The median sales price of Gem County homes sold in January reached $331,000, up 34.9% from the same month a year ago. Due to the smaller number of transactions that occur in the area, we use a rolling 12-month median sales price to get a better idea of the overall trends.
For many sellers, higher home prices usually mean greater equity, which can be used for another home purchase, to fund a new business, send a child to college, or a variety of other opportunities.
For some buyers, the higher prices have caused affordability challenges, while others have found the low mortgage rates have increased their purchase power, despite the rising prices. The average rate for a 30-year fixed mortgage was 2.73% in January 2021 compared to 3.60% last year.
There were 19 homes available for purchase at the end of the month, down 54.8% from the year before. While the Gem County housing market is experiencing low inventory, this does not mean there is “no inventory” available. There were 22 homes sold in January 2021, an increase of 37.5% compared to January 2020, and another 79 homes were under contract, a 92.7% increase year-over-year. High demand and low inventory make it imperative to work with a REALTOR®, whether you’re looking to buy or sell.
A REALTOR® provides buyers the advice and data needed to make informed quickly and may be able to identify properties that are not yet on the market. Sellers find value in a REALTOR®‘s ability to help them evaluate multiple offers, oversee the negotiating process, as well as all the legal, financial, and administrative steps that come after the offer has been accepted. And for both groups, a REALTOR® can provide guidance in planning and preparing for a purchase or listing, long before any offers are accepted or for sale signs are put up.
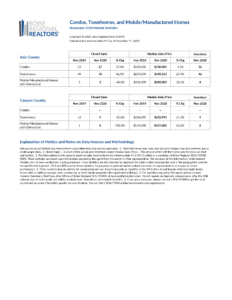
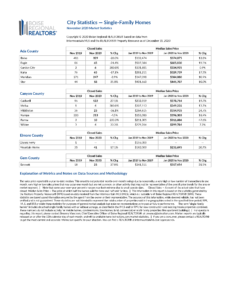
Additional information about trends within the Boise Region, by price point, by existing and new construction, and by neighborhood, are now available here: Ada County, Elmore County, Gem County, City Statistics, and Condos, Townhouses, and Mobile/Manufactured Homes Market Reports. Each includes an explanation of the metrics and notes on data sources and methodology.
Download the latest (print quality) market snapshot graphics for Ada County, Ada County Existing/Resale, Ada County New Construction, Elmore County, and Gem County. Since Canyon County is not part of BRR’s jurisdiction, we don’t report on Canyon County market trends. Members can access Canyon County snapshots and reports as well as weekly snapshots in the Market Report email, or login to our Market Statistics page.
In addition to the market reports and analysis BRR sends members each month, we send press releases to local media contacts in order to promote the local market expertise that REALTORS® bring to every transaction. BRR’s market report data and/or interviews are featured in the following articles. Feel free to share with your clients, adding your own analysis and comments.
- ‘Frantic:’ Homes in Ada & Canyon sell fast, with big increases over past year from BoiseDev.com
- Ada County’s median home sale price has jumped more than 300% since 2011 from KTVB
- Treasure Valley single-family homes continue torrid pace from Idaho Business Review
# # #
While this report provided an explanation on our inventory metrics, even with the variables that affect the monthly counts, the information from IMLS remains the most complete and reliable database for tracking our local housing market, helping home buyers, home sellers, and their REALTORS® make the best decisions for their unique situations.
Boise Regional REALTORS® has a variety of resources about mortgage assistance, unemployment assistance, how to avoid scams, and more, under the Resources for Property Owners and Resources for Renters sections of BRR’s Coronavirus Response website.
This report is provided by Boise Regional REALTORS® (BRR), a 501(c)(6) trade association, representing real estate professionals throughout the Boise region. Established in 1920, BRR is the largest local REALTOR® association in the state of Idaho, helping members achieve real estate success through ethics, professionalism, and connections. BRR has two wholly-owned subsidiaries, Intermountain MLS (IMLS) and the boirealtors.com/connect/foundation/.
If you have questions about this report, please contact Cassie Zimmerman, Director of Communications for Boise Regional REALTORS®. If you are a consumer, please contact a REALTOR® to get the most current and accurate information specific to your situation.
The data reported is based primarily on the public statistics provided by the IMLS. These statistics are based upon information secured by the agent from the owner or their representative. The accuracy of this information, while deemed reliable, has not been verified and is not guaranteed. These statistics are not intended to represent the total number of properties sold in the counties or cities during the specified time period. The IMLS and BRR provide these statistics for purposes of general market analysis but make no representations as to past or future performance.
REALTOR® is a federally registered collective membership mark which identifies a real estate professional who is member of the National Association of REALTORS® and subscribes to its strict Code of Ethics.

