EXISTING HOUSING SUPPLY UP IN JANUARY
AFTER 51 CONSECUTIVE MONTHS OF DECLINES
Key Takeaways:
- January 2019 was the first time since October 2014 that the year-over-year number of existing homes for sale in Ada County increased, rather than decreased, up 5.9% from January 2018.
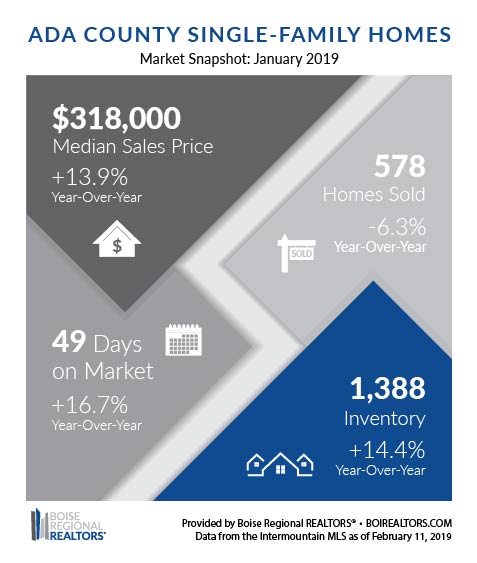
- Despite this uptick in existing inventory, closed sales were down 6.3% year-over-year. The number of closed sales that are even possible was limited due to the fact we’ve had fewer and fewer existing homes to sell each month compared to buyer demand.
- This additional inventory impacted the months supply of existing/resale inventory in Ada County, which was at 1.2 months in January, for all price points combined, up from 0.9 months as of January and was higher than we saw in any month in 2018 except for one.
Analysis:
Did the new year bring with it a new trend in the housing market for Ada County? While one month of existing inventory increases can’t be considered a trend, January 2019 was the first time since October 2014 that the number of existing homes for sale in Ada County was higher than the same month the previous year — up 5.9% compared to January 2018. We’re hopeful that this year-over-year increase is the start of inventory coming back into balance, however, we still have quite a ways to go before that happens.
Any increase in housing inventory is welcome news to those who’ve been looking to buy. If you’ve been considering a move, now would be a great time to talk to your REALTOR® about what’s newly available.
Despite this recent uptick in existing inventory, overall closed sales were down 6.3% year-over-year. Looking at the existing/resale segment specifically, sales were down 18.6% from a year ago. The number of closed sales that are even possible has been limited due to the fact we’ve had fewer and fewer existing homes to sell each month compared to buyer demand for over four years. The logic is simple — buyers haven’t been able to buy homes that aren’t for sale.
Speaking of buyer demand, the “Months Supply of Inventory” metric is a way to measure the relationship between inventory and buyer demand. This metric takes the number of homes for sale (inventory) divided by the average number of closed sales by month for the preceding twelve months. The resulting number can be described as the number of months it would take to sell through all the available supply assuming no other homes came on the market.
As of January 2019, the months supply of existing/resale inventory in Ada County was at 1.2 months, for all price points combined, up from 0.9 months in January 2018, when looking year-over-year, as well as December 2018 looking month-to-month. Still a far cry from the 4-6 months of supply that is considered “balanced,” but a small step in that direction. We will continue to monitor these metrics to see if the trend continues into spring.
HOME SALES AND PRICES UP IN ELMORE COUNTY IN JANUARY
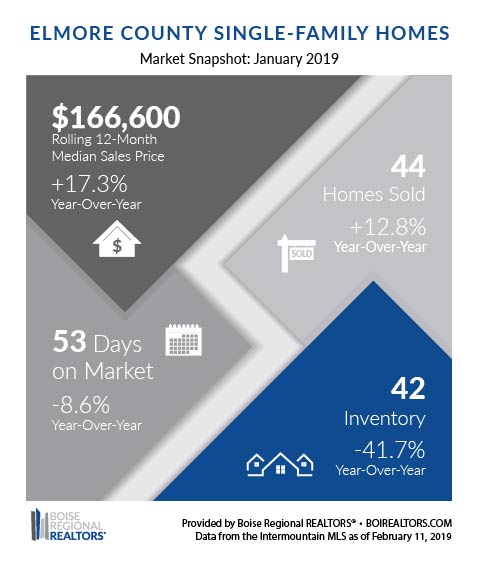
In January 2019, 44 homes sold in Elmore County, up 12.8% over last year. This left 42 homes available for sale at the end of the month — a decrease of 41.7% year-over-year. Like other areas in southwest Idaho, and nationwide, Elmore County has seen a dwindling supply of existing/resale homes for sale in recent years.
Looking at sales over the past 12 months, the median price for homes that sold through January 2019 was $166,600 — up 17.3% over the same period last year.
Due to the smaller number of sales in the county, the 12-month average is a helpful way of analyzing area price trends, as it adjusts for any months in which a very high- or low-priced home sold that would otherwise be inconsistent with the general market.
Apparently, the colder temps haven’t deterred buyers in Elmore County. Thinking about selling? Talk your REALTOR® to find out what your home may be worth and what options are available based on your specific situation.
GEM COUNTY HOME SALES DOWN IN JANUARY
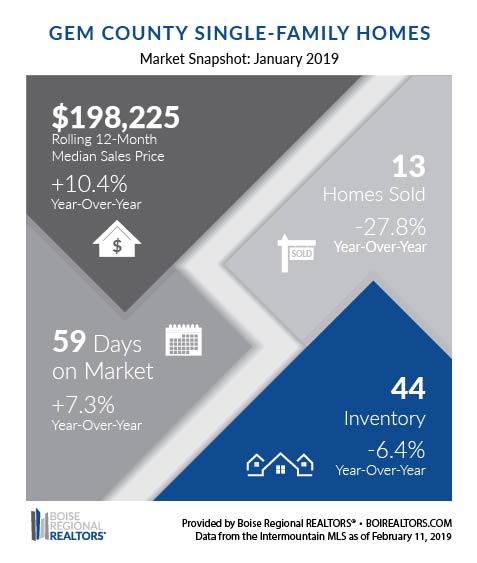
In January 2019, 13 homes sold in Gem County, down 27.8% from last year. This left 44 homes available for sale at the end of the month — a decrease of 6.4% year-over-year. This drop in sales could be due in part to seasonality, and the fact that Gem County has had persistently low existing/resale inventory for the last several years.
What does that mean for home sales in the coming months? Homes under contract, also called “pending sales,” are properties with an accepted offer that should close within 30-90 days. Pending sales were also down year-over-year in January by 4.8%, but up from the previous month by 33.3%, so February and March will likely bring more sales than what we saw in the first month of 2019.
Looking at sales over the past 12 months, the median price for homes that sold through January 2019 was $198,225 — up 10.4% over the same period last year.
Due to the smaller number of sales in the county, the 12-month average is a helpful way of analyzing area price trends, as it adjusts for any months in which a very high- or low-priced home sold that would otherwise be inconsistent with the general market.
Although home sales are down a bit compared to January 2018 in Gem County, we don’t anticipate that will continue as we head into the spring market. And with prices where they are, those who are selling are getting a great value for their homes. If you think you might be ready for a move, talk your REALTOR® to find out what options are available based on your specific situation.
RESOURCES:
Additional information about trends within the Boise Region, by price point, by existing and new construction, and by neighborhood, are now available here: Ada County, Elmore County, Gem County, and City Data Market Reports. Each includes an explanation of the metrics and notes on data sources and methodology.
Download the latest (print quality) market snapshot graphics for Ada County, Ada County Existing/Resale, Ada County New Construction, Elmore County and Gem County.
# # #
This report is provided by Boise Regional REALTORS® (BRR), a 501(c)(6) trade association, representing real estate professionals throughout the Boise region. Established in 1920, BRR is the largest local REALTOR® association in the state of Idaho, helping members achieve real estate success through ethics, professionalism, and connections. BRR has two wholly-owned subsidiaries, Intermountain MLS (IMLS) and the REALTORS® Community Foundation.
If you have questions about this report, please contact Cassie Zimmerman, Director of Communications for Boise Regional REALTORS®. If you are a consumer, please contact a REALTOR® to get the most current and accurate information specific to your situation.
The data reported is based primarily on the public statistics provided by the IMLS. These statistics are based upon information secured by the agent from the owner or their representative. The accuracy of this information, while deemed reliable, has not been verified and is not guaranteed. These statistics are not intended to represent the total number of properties sold in the counties or cities during the specified time period. The IMLS and BRR provide these statistics for purposes of general market analysis but make no representations as to past or future performance. The term “single-family homes” includes detached single-family homes with or without acreage, as classified in the IMLS. These numbers do not include activity for mobile homes, condominiums, townhomes, land, commercial, or multi-family properties (like apartment buildings).


