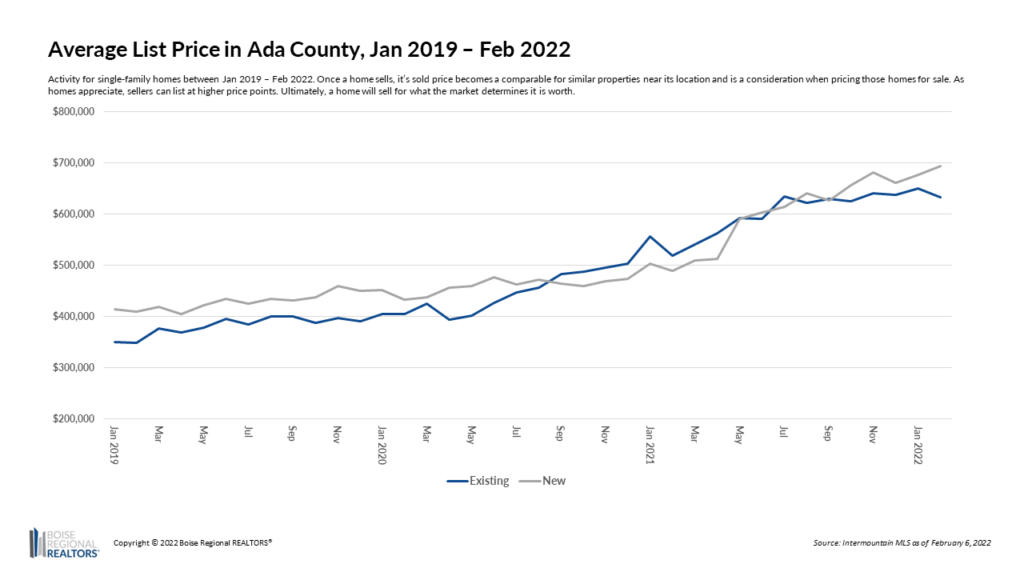
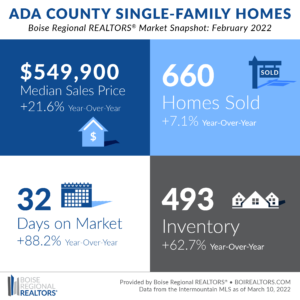
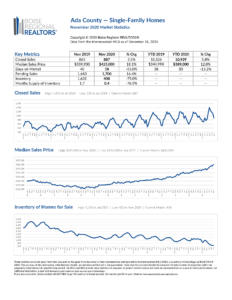
The median sales price for Ada County reached $549,900 in February 2022, an increase of 21.6% compared to February 2021, and a new record for the county. Home prices continued to be driven by insufficient supply compared to buyer demand and indicate we will likely see another competitive spring market.
Two metrics that demonstrate the competitiveness of the market include Days on Market and Percent of Original List Price received.
After enjoying a more normalized market pace in January, Days on Market for existing homes sped up in February to 23 days, on average. This counts the number of days between when a home was listed and when the seller an accepted offer. While this is a year-over-year increase of 14 days, or 155.6%, it’s a dramatic drop from January 2022 when the average was 33 days. Buyers may have a bit more time to shop, than they did last year, but will still likely need to make quick decisions once they find a home they’d like to purchase.
The Percent of Original List Price received for existing homes was at 99.6%, on average, in February. This means buyers paid slightly less than asking through a lower accepted offer or seller concessions. In contrast, buyers paid an average of 105.5% of the list price last year. Buyers may be unable or unwilling to spend over list prices to win a listing, as was common a year ago, or we’re seeing sellers pricing homes more in line with the market comparables.
Overall, we are seeing fewer bidding wars than last year, but that doesn’t mean it isn’t still happening in some instances. It just depends on the particular property, the list price, and what buyers are willing to pay.
At first glance, it may seem odd that home prices have gone up so significantly when, on average, buyers are paying close to asking price. However, as mentioned, each home sale becomes a comparable for future home sales of properties in the same location and with similar amenities, which is taken into consideration when pricing a new listing. So as homes appreciate, sellers are asking, and receiving, more for their homes than they have in the past.
But the list price is just a starting point — as indicated by the Percent of Original List Price received metric — sometimes buyers pay more, and sometimes they pay less. Ultimately, a home sells for what the market determines it’s worth.
It may be tempting to price your home lower than what the comparable data indicates it may be worth, in order to drive up the price with multiple offers. But it’s important to remember that pricing low doesn’t guarantee a bidding war. Pricing higher than what comparable sales support may exclude your property from the search criteria of possible buyers. Using market data, your REALTOR® will provide you with a pricing range and help you form a strategy to get your home in front of the maximum number of buyers so you can receive maximum value.
Another contributing factor that drove up the overall median sales price in February was the larger share of new construction home sales for the month. Due to increasing costs and shortages of materials, as well as increasing costs of land and labor, the median sales price for new homes was 30.6% higher than the same month a year ago, coming in at $587,551. In February, new construction homes made up 36.7% of all home sales, which also pushed up the overall median sales price for the county.
Other notable statistics from February 2022:
- There were 493 homes available at the end of the month — 62.7% more than in February 2021 — although still very low compared to buyer demand.
- Of the 660 sales in the county, 418 were existing homes, an increase of 21.9% compared to the year prior. Overall sales (existing and new combined) were up 7.1% compared to January 2021.
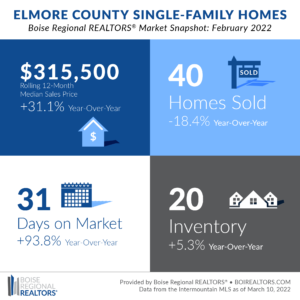
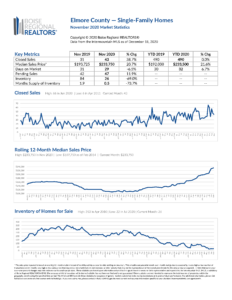
The median sales price for Elmore County home sales was $315,500 in February 2022, a 31.1% increase from the year before. Due to the smaller number of transactions that occur in the area, we use a rolling 12-month median sales price to get a better idea of the overall trends.
Prices have continued to rise due to the demand for homes, which has outpaced the supply of homes for sale. The metric used to illustrate the supply vs. demand relationship is Months Supply of Inventory (MSI), which takes the number of homes for sale divided by the average number of sales by month for the preceding 12 months.
As of February 2022, Elmore County was at just 0.4 months, meaning, if no additional homes were listed, the supply of homes would run out in a matter of weeks. A balanced market — not favoring buyers or sellers — is typically between 4-6 months of supply. Inventory in the existing segment is even more constrained with only 0.2 months of supply.
Despite the lack of supply, on average, buyers paid less than asking through a lower accepted offer or seller concessions for existing homes sold in February. The Percent of Original List Price received was 96.8%, compared to 99.2% for the same month last year.
There were 40 sales in the county in February 2022, a decrease of 18.4% compared to the same month last year. 32 of those sales were existing/resale homes, and eight were new homes.
This market is undersupplied and would welcome any and all new listings. If you’re thinking about selling, talk to REALTOR® to understand your options and develop a plan to reach your real estate goals.
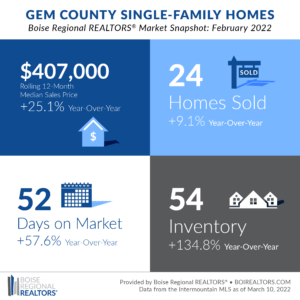
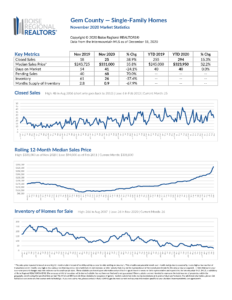
There were 54 homes available for purchase at the end of February, a 134.8% increase compared to a year ago. February marks the 10th month of year-over-year gains in housing supply for the county.
Despite these gains, demand for homes continue to outpace the supply. Months Supply of Inventory (MSI), which takes the number of homes for sale divided by the average number of sales by month for the preceding 12 months, was at 1.6 months in February. This means that if no additional homes were listed, the supply of homes would run out in approximately six weeks. A balanced market — not favoring buyers or sellers — is typically between 4-6 months of supply.
This supply vs. demand dynamic continued to drive prices, as the median sales price for Gem County home sales was $407,000 in February 2022, a 25.1% increase from the year before. Due to the smaller number of transactions that occur in the area, we use a rolling 12-month median sales price to get a better idea of the overall trends.
There were 24 sales in the county in February 2022, an increase of 9.1% compared to the same month last year. Of those sales, 20 were existing/resale homes, and four were new homes.
On average, buyers paid less than asking through a lower accepted offer or seller concessions for existing homes sold in February. The Percent of Original List Price received was 97.9%, compared to 102.8% for the same month last year.
We’re glad to see inventory inching up in Gem County, though we have a long way to go before the market is considered balanced again.If you’ve been thinking about selling, know that the buyer demand is there, and sellers have been receiving great values for their homes.
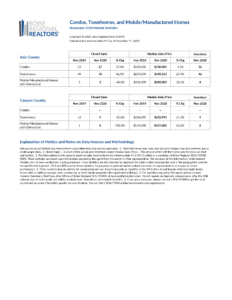
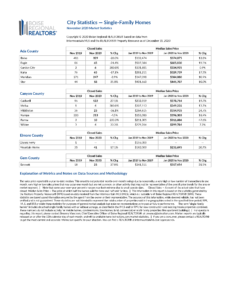
Additional information about trends within the Boise Region, by price point, by existing and new construction, and by neighborhood, are now available here: Ada County, Elmore County, Gem County, City Statistics, and Condos, Townhouses, and Mobile/Manufactured Homes Market Reports. Each includes an explanation of the metrics and notes on data sources and methodology.
Download the latest (print quality) market snapshot graphics for Ada County, Ada County Existing/Resale, Ada County New Construction, Elmore County, and Gem County. Since Canyon County is not part of BRR’s jurisdiction, we don’t publicly report on Canyon County market trends. Members can access Canyon County snapshots and reports in the Market Report email, or login to our Market Statistics page. Boise and Owyhee County snapshots can also be accessed on our Market Statistics page.
# # #
The data reported is based primarily on the public statistics provided by the Intermountain MLS (IMLS), a subsidiary of Boise Regional REALTORS® (BRR). These statistics are based upon information secured by the agent from the owner or their representative. The accuracy of this information, while deemed reliable, has not been verified and is not guaranteed. These statistics are not intended to represent the total number of properties sold in the counties or cities during the specified time period. The IMLS and BRR provide these statistics for purposes of general market analysis but make no representations as to past or future performance. If you have questions about this report, please contact Pete Clark, Director of Communications for Boise Regional REALTORS®. For notes on data sources, methodology, and explanation of metrics, visit boirealtors.com/notes-on-data-sources-and-methodology.
If you are a consumer, please contact a REALTOR® to get the most current and accurate information specific to your situation. For those seeking information on mortgage and rental assistance, including down payment programs, visit the Resources for Property Owners and Renters sections of BRR’s website.
Boise Regional REALTORS® (BRR), a 501(c)(6) trade association, represents real estate professionals throughout the Boise region. Established in 1920, BRR is the largest local REALTOR® association in the state of Idaho, helping members achieve real estate success through ethics, professionalism, and connections. BRR has two wholly-owned subsidiaries, Intermountain MLS (IMLS) and the REALTORS® Community Foundation.
“REALTOR®” is a federally registered collective membership mark which identifies a real estate professional who is member of the National Association of REALTORS® (NAR) and subscribes to its strict Code of Ethics.

