Despite rising home prices, today’s housing market doesn’t have much else in common with the market we saw prior to the recession.
The Boise Region’s housing market is being driven by real home buyer demand, not speculation, which was common a decade ago. And as we’ve mentioned before, the increase in demand and lack of inventory has pushed up home prices.
That demand for housing can be seen in the data (real or speculative) by looking at the Days on Market.
Days on Market metric (or DOM) counts the average number of days between when a property was listed and when an offer was accepted.
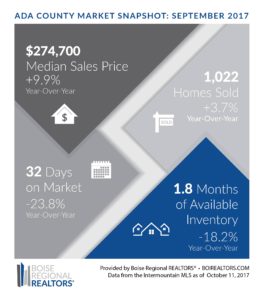
For example, in Ada County, home sales that closed in September spent an average of 32 days on the market before going under contract, 23.8% faster than in September 2016.
DOM doesn’t factor in the time between accepting an offer and closing (which can vary based on the time it takes to complete home inspections, repairs, financing, etc.), so it is a good indicator of the demand for housing, and how quickly sellers find buyers.
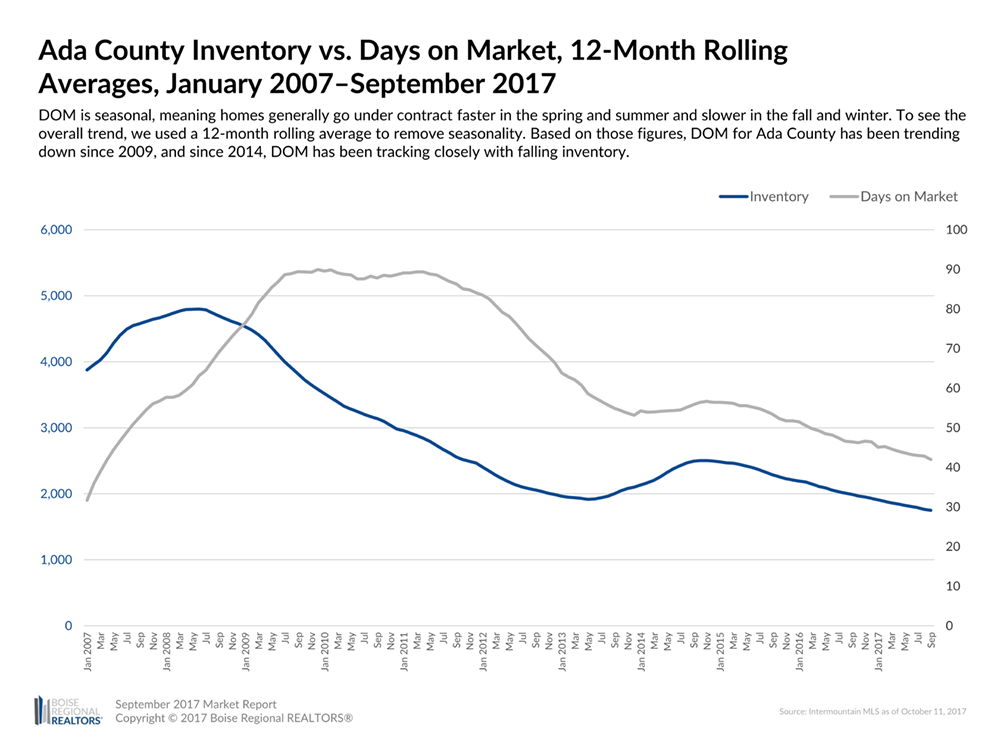
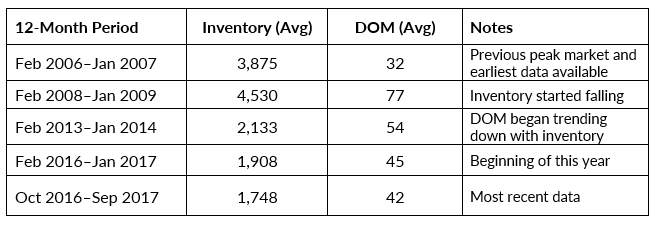
DOM is seasonal, meaning homes generally go under contract faster in the spring and summer and slower in the fall and winter. To see the overall trend, we used a 12-month rolling average to remove seasonality. Based on those figures, DOM for Ada County has been trending down since 2009, and since 2014, DOM has been tracking closely with falling inventory.
The very low DOM of 32 days on average, between February 2006 and January 2007, shows just how quickly buyers were snatching up homes, despite having plenty of inventory to choose from. In the past year or so we’ve experienced quite the opposite — low DOM and very low inventory.
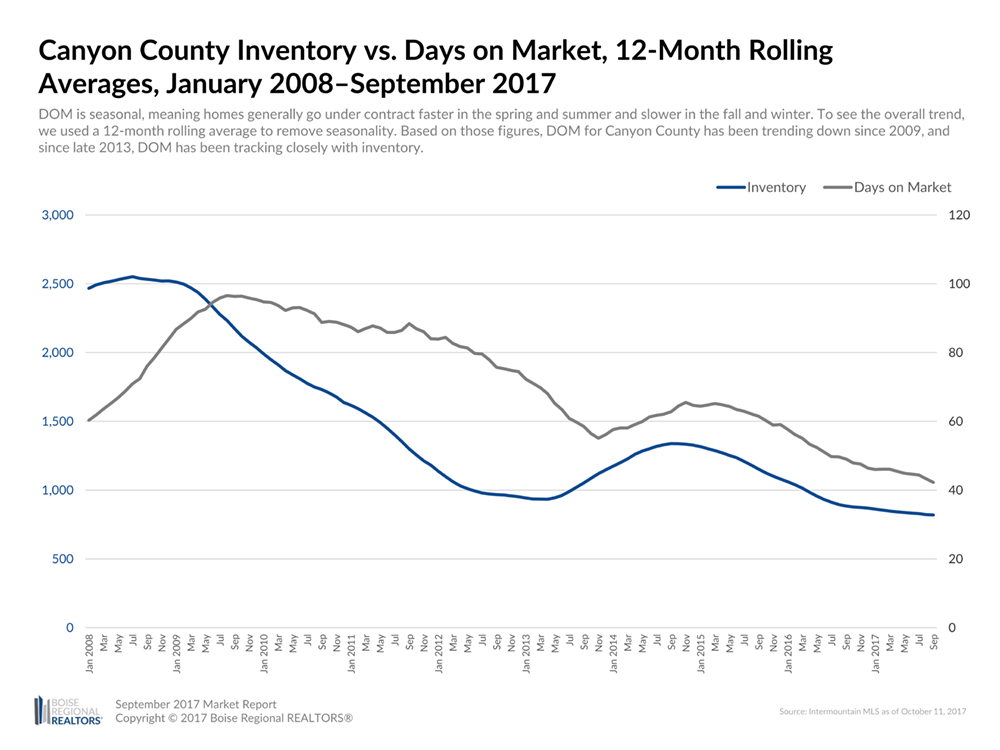 Prior to the recession, Canyon County saw a similar trend with shorter average DOM despite plenty of inventory to meet demand. Since late 2013, DOM has been tracking closely with inventory, indicating increasing demand as inventory drops.
While that historical comparison is another helpful distinction between today’s market and the pre-recession market, it’s not much consolation for today’s buyers who are often required to make quick decisions because of limited inventory. Unless there is a sudden influx of inventory or a quick drop in demand, we expect the market to continue to move quickly, even if we see some slight increases in Days on Market through the winter.
Additional information about trends within each county, by price point, by existing and new construction, and by neighborhood, are now available in the September 2017 Market Report. This report includes an explanation of the metrics and notes on data sources and methodology.
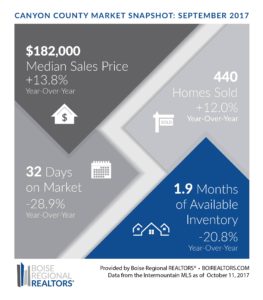
Download the latest market snapshot graphics for Ada County and Canyon County:
# # #
This report is provided Boise Regional REALTORS® (BRR). BRR is the largest local REALTOR® association in Idaho, with over 4,300 members and two wholly-owned subsidiaries — the Intermountain Multiple Listing Service, Inc. (IMLS) and the Boise Regional REALTORS® Foundation. This report is based primarily on the public statistics provided by the IMLS, available at: intermountainmls.com/Statistics/Static.aspx. These statistics are based upon information secured by the agent from the owner or their representative. The accuracy of this information, while deemed reliable, has not been verified and is not guaranteed. These statistics are not intended to represent the total number of properties sold in the counties or cities during the specified time period. The IMLS and BRR provide these statistics for purposes of general market analysis but make no representations as to past or future performance. || The term “single-family homes” includes detached single-family homes with or without acreage, as classified in the IMLS. These numbers do not include activity for mobile homes, condominiums, townhomes, land, commercial, or multi-family properties (like apartment buildings). If you are a consumer, please contact a REALTOR® to get the most current and accurate information specific to your situation.

