We cannot have a 2020 review without first addressing the impact that COVID-19 had on the real estate market locally.
The year started strong with January 2020 sales 21.5% higher than in January 2019 but began to taper off in February and March as the uncertainties of the pandemic made their way to our local market. In April and May, when our spring market typically begins to ramp up, sales activity dropped by 19.5% and 29.7%, respectively, because of the government-mandated shutdowns and restrictions.
Sales began to pick up in June, then jumped 22.0% year-over-year in July and remained elevated through November, compressing nearly a year’s worth of activity into just six months.
Despite the many challenges to buying and selling homes during the pandemic, home sales were able to continue due to a greater adoption of virtual technology for showings which limited in-person activities, as well as additional steps taken by REALTORS® to protect clients and properties when meeting in person couldn’t be avoided.
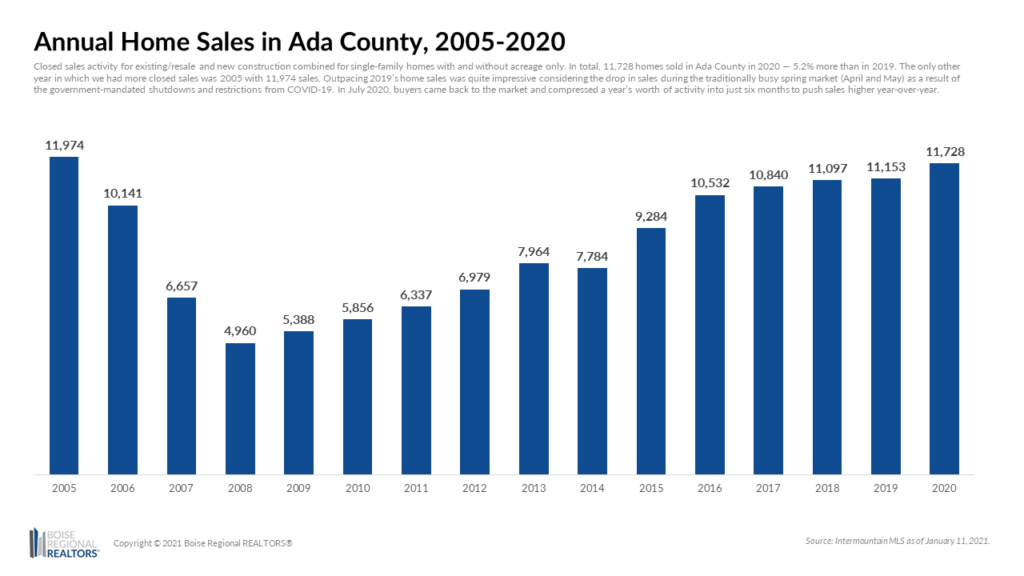
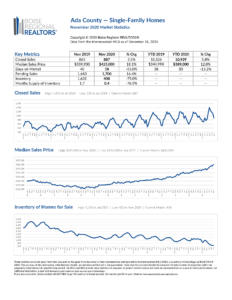
In total, 11,728 homes sold in Ada County in 2020 — 5.2% more than in the previous year. The only other time we saw more sales in one year was in 2005 which had 11,974 sales. This represents existing and new construction combined.
Low Mortgage Rates Increase Purchase Power
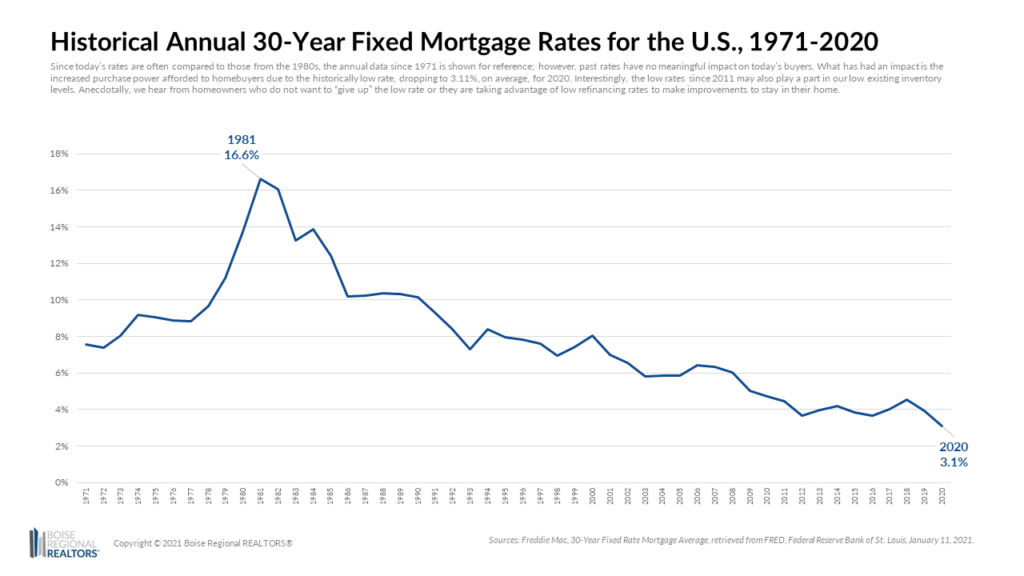
Historically low interest rates allowed home sales to quickly recover and then outpace 2019 levels. According to Freddie Mac, the 30-year fixed rate mortgage in the U.S. was at 3.11% on average in 2020 — the lowest ever based on data going back to 1971. These low rates increased purchasing power for buyers, allowing them buy despite rising prices, and in some cases, compete in multiple offer situations.
Home Prices Driven by Supply vs. Demand
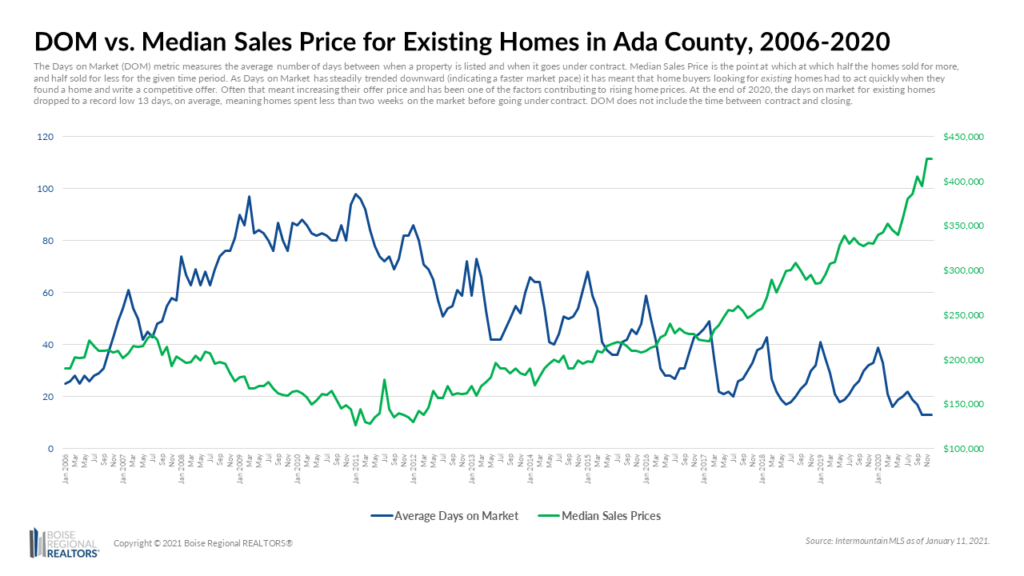
A major factor that pushed home prices up was insufficient supply compared to demand, especially for existing inventory. For most of the year, the average Days on Market metric (DOM) for existing homes was at 20 days in 2020, on average, compared to 42 days in 2019. Then in October, DOM dropped to just 13 days — a record low based on data going back to 2004. This meant buyers had to act quickly and write a competitive offer when they found a home.
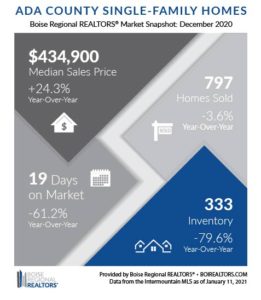
On the last day of December 2020, there were just 333 homes available for sale, for both existing and new construction combined — 79.6% lower than December 2019 and a record low based on data going back to 2004. More inventory is needed to bring balance back into the market at all price points and product types.
This begs the question, “How can home sales be up while inventory continues to drop?”
Unlike the closed sales metric which reflects all homes sold during the month, the inventory metric fluctuates daily and is based on the number of homes listed as “active” in the multiple listing service on a given day. For our monthly reports, it’s the last day of the month. This “snapshot” of inventory compared to a monthly total of sales is one reason we can see more closings than available inventory.
Additionally, once a seller accepts an offer, the home is no longer considered available inventory. With the average Days on Market at less than a month, many properties that were available during the month are not reflected in the reported inventory “snapshot” at the end of the month.
Factors Restricting Inventory
The historically low mortgage rates mentioned earlier also caused a surge in refinancing at the beginning of the year (SOURCE) which likely kept some of the existing homes that may have otherwise been listed for sale off the market. Then after COVID hit, it further reduced the number of homeowners willing to sell due to safety concerns or general uncertainty. While we cannot quantify how many homeowners held back from listing, it was something we heard often from REALTORS® throughout the year.
In addition to the impacts of refinancing and safety concerns, there were a variety of other reasons existing/resale inventory has been so limited. Many homeowners have delayed listing until they find their next home, which takes longer due to already limited and fast-moving inventory; some homeowners may not have felt they could “trade up” from their current home due to current prices, despite equity and low mortgage rates; or people may have been unable to manage a sale while working from home or if they had children at home for school.
Interestingly, the push to stay home for work and school as a result of COVID had people across the country re-evaluating where they wanted to live. Wills added, “It’s no secret that Idaho has been one of the top states experiencing growth over the past few years, and the ability for many to work from anywhere brought more interest than ever, equating to even more demand for homes in our market.”
The Role of New Construction
The lack of existing/resale inventory put tremendous demand on builders, and they have been responding. According to Construction Monitor, 3,336 permits were approved for new single-family homes throughout Ada County during 2020. When we compare this permit count to the 4,010 new homes that sold in 2020, it suggests that we are not overbuilding as demand is absorbing all supply that becomes available, reinforcing the need for continued building.
New home sales made up 34.2% of all sales in 2020, up slightly from 2019. New construction typically costs more than an existing home, due to higher increasing land, labor, and materials, so as the share of new home sales increases, it pushed up the overall median sales price. The median sales price for new construction in Ada County in 2020 was $424,995 compared to $375,000 for existing homes. Taking the two segments together, the median sales price for the market overall was $392,230 in 2020.
Looking Forward
Looking forward to 2021, the Boise Metro area continues to be among many economists’ top picks for markets that should see continued growth. The National Association of REALTORS® even included Boise in their list of markets that are “expected to perform well in a post-COVID-19 environment.” (SOURCE)
To help balance the market out, again, we need more inventory among new and existing product. We hope to see more homeowners list in the coming months and take advantage of the ongoing demand. One additional opportunity for more existing inventory, though, comes from investors holding single-family properties. Investors should talk to a REALTOR® and tax professional to understand their options for selling their rental homes and potentially rolling proceeds into other sectors such as commercial or multi-family to diversify their portfolios.
A fast, competitive market like ours presents challenges and opportunities to buyers and sellers alike. Whether you’re looking to buy or sell, it’s never been more important to work with a REALTOR®. They will help identify potential options for purchase, connect you with a mortgage lender, help craft a competitive offer, and negotiate on your behalf, allowing you to make decisions confidently and quickly to achieve your real estate goals.
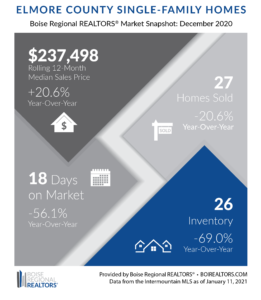
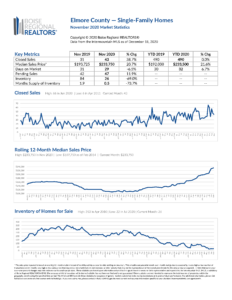
Despite the uncertainties and challenges posed by the pandemic, there were 517 homes sold in Elmore County in 2020, down just slightly from the 524 sold in 2019. Of those, 448 were existing sales, while 69 were new construction — up significantly from 2019 when there were just 17 new homes sold.
New homes typically sell at higher price points, due to increased costs of land, labor and construction materials, so this larger share of new construction sales brought up the overall median sales price of homes in Elmore County to $235,000 year-to-date (January 1—December 31, 2020) an increase of 20.5% over the same period in 2019.
Prices also continued to be driven by insufficient supply compared to buyer demand. There were only 26 homes available for purchase at the end of December 2020, a decrease of 69.0% from December 2019.
The Days on Market metric (DOM) measures the average number of days between when a property is listed and when it goes under contract. For existing homes, DOM was at 22 days on average in 2020 compared to 28 days in 2019. In November and December, it dropped to 16 and 18 days, respectively, an indication that we haven’t seen a typical winter slow down. This faster market meant buyers had to act quickly and write a competitive offer when they found a home.
Increasing home prices may seem daunting, however, historically low mortgage rates increased purchasing power for buyers. According to Freddie Mac, the 30-year fixed rate mortgage in the U.S. was at 3.11% on average in 2020 — the lowest ever based on data going back to 1971.
The historically low mortgage rates also caused a surge in refinancing earlier this year that likely kept some of the existing homes that may have otherwise been listed for sale off the market. (SOURCE) Then after COVID hit, it further reduced the number of homeowners willing to sell due to safety concerns or general uncertainty.
In addition to the impacts of refinancing and safety concerns, there were a variety of other reasons existing/resale inventory has been so limited. Many homeowners have delayed listing until they find their next home, which takes longer due to already limited and fast-moving inventory; some homeowners may not have felt they could “trade up” from their current home due to current prices, despite equity and low mortgage rates; or people may have been unable to manage a sale while working from home or if they had children at home for school.
To help balance the market out, we need more available inventory among new and existing product. We hope to see more homeowners list in the coming months and take advantage of the ongoing demand. One additional opportunity for more existing inventory, though, comes from investors holding single-family properties. Investors should talk to a REALTOR® and tax professional to understand their options for selling their rental homes and potentially rolling proceeds into other sectors such as commercial or multi-family to diversify their portfolios.
A fast, competitive market like ours presents challenges and opportunities to buyers and sellers alike. Whether you’re looking to buy or sell, it’s never been more important to work with a REALTOR®. They will help identify potential options for purchase, connect you with a mortgage lender, help craft a competitive offer, and negotiate on your behalf, allowing you to make decisions confidently and quickly to achieve your real estate goals.
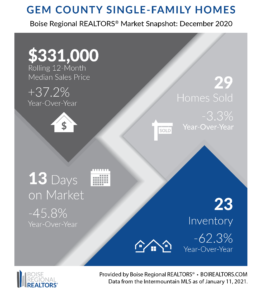
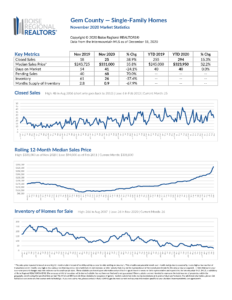
Despite the uncertainties and challenges posed by the pandemic, there were 324 homes sold in Gem County in 2020, up 13.7% from 2019. The overall median sales price of homes sold in Gem County reached $319,950 year-to-date (January 1—December 31, 2020) an increase of 30.6% over the same period in 2019.
Prices have been driven by insufficient supply compared to buyer demand. There were only 23 homes available for purchase at the end of December 2020, a decrease of 62.3% compared to December 2019. We saw a year-over-year declines in inventory every month of the year except March.
The Days on Market metric (DOM) measures the average number of days between when a property is listed and when it goes under contract. For existing homes, DOM was at 38 days on average in 2020, however in the month of December, it dropped to just 12 days. This faster market meant buyers had to act quickly and write a competitive offer when they found a home.
Increasing home prices may seem daunting, however, historically low mortgage rates increased purchasing power for buyers. According to Freddie Mac, the 30-year fixed rate mortgage in the U.S. was at 3.11% on average in 2020 — the lowest ever based on data going back to 1971.
The historically low mortgage rates also caused a surge in refinancing earlier this year that likely kept some of the existing homes that may have otherwise been listed for sale off the market. (SOURCE) Then after COVID hit, it further reduced the number of homeowners willing to sell due to safety concerns or general uncertainty.
In addition to the impacts of refinancing and safety concerns, there were a variety of other reasons existing/resale inventory has been so limited. Many homeowners have delayed listing until they find their next home, which takes longer due to already limited and fast-moving inventory; some homeowners may not have felt they could “trade up” from their current home due to current prices, despite equity and low mortgage rates; or people may have been unable to manage a sale while working from home or if they had children at home for school.
To help balance the market out, we need more available inventory among new and existing product. We hope to see more homeowners list in the coming months and take advantage of the ongoing demand. One additional opportunity for more existing inventory, though, comes from investors holding single-family properties. Investors should talk to a REALTOR® and tax professional to understand their options for selling their rental homes and potentially rolling proceeds into other sectors such as commercial or multi-family to diversify their portfolios.
A fast, competitive market like ours presents challenges and opportunities to buyers and sellers alike. Whether you’re looking to buy or sell, it’s never been more important to work with a REALTOR®. They will help identify potential options for purchase, connect you with a mortgage lender, help craft a competitive offer, and negotiate on your behalf, allowing you to make decisions confidently and quickly to achieve your real estate goals.
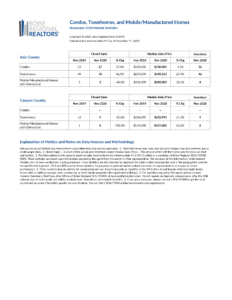
Additional information about trends within the Boise Region, by price point, by existing and new construction, and by neighborhood, are now available here: Ada County, Elmore County, Gem County, City Statistics, and Condos, Townhouses, and Mobile/Manufactured Homes Market Reports. Each includes an explanation of the metrics and notes on data sources and methodology.
Download the latest (print quality) market snapshot graphics for Ada County, Ada County Existing/Resale, Ada County New Construction, Elmore County, and Gem County. Since Canyon County is not part of BRR’s jurisdiction, we don’t report on Canyon County market trends. Members can access Canyon County snapshots and reports as well as weekly snapshots in the Market Report email, or login to our Market Statistics page.
In addition to the market reports and analysis BRR sends members each month, we send press releases to local media contacts in order to promote the local market expertise that REALTORS® bring to every transaction. BRR’s market report data and/or interviews are featured in the following articles. Feel free to share with your clients, adding your own analysis and comments.
# # #
While this report provided an explanation on our inventory metrics, even with the variables that affect the monthly counts, the information from IMLS remains the most complete and reliable database for tracking our local housing market, helping home buyers, home sellers, and their REALTORS® make the best decisions for their unique situations.
Boise Regional REALTORS® has a variety of resources about mortgage assistance, unemployment assistance, how to avoid scams, and more, under the Resources for Property Owners and Resources for Renters sections of BRR’s Coronavirus Response website.
This report is provided by Boise Regional REALTORS® (BRR), a 501(c)(6) trade association, representing real estate professionals throughout the Boise region. Established in 1920, BRR is the largest local REALTOR® association in the state of Idaho, helping members achieve real estate success through ethics, professionalism, and connections. BRR has two wholly-owned subsidiaries, Intermountain MLS (IMLS) and the boirealtors.com/connect/foundation/.
If you have questions about this report, please contact Cassie Zimmerman, Director of Communications for Boise Regional REALTORS®. If you are a consumer, please contact a REALTOR® to get the most current and accurate information specific to your situation.
The data reported is based primarily on the public statistics provided by the IMLS. These statistics are based upon information secured by the agent from the owner or their representative. The accuracy of this information, while deemed reliable, has not been verified and is not guaranteed. These statistics are not intended to represent the total number of properties sold in the counties or cities during the specified time period. The IMLS and BRR provide these statistics for purposes of general market analysis but make no representations as to past or future performance.
REALTOR® is a federally registered collective membership mark which identifies a real estate professional who is member of the National Association of REALTORS® and subscribes to its strict Code of Ethics.

