2019 RESIDENTIAL REAL ESTATE MARKET REPORT FOR ADA COUNTY
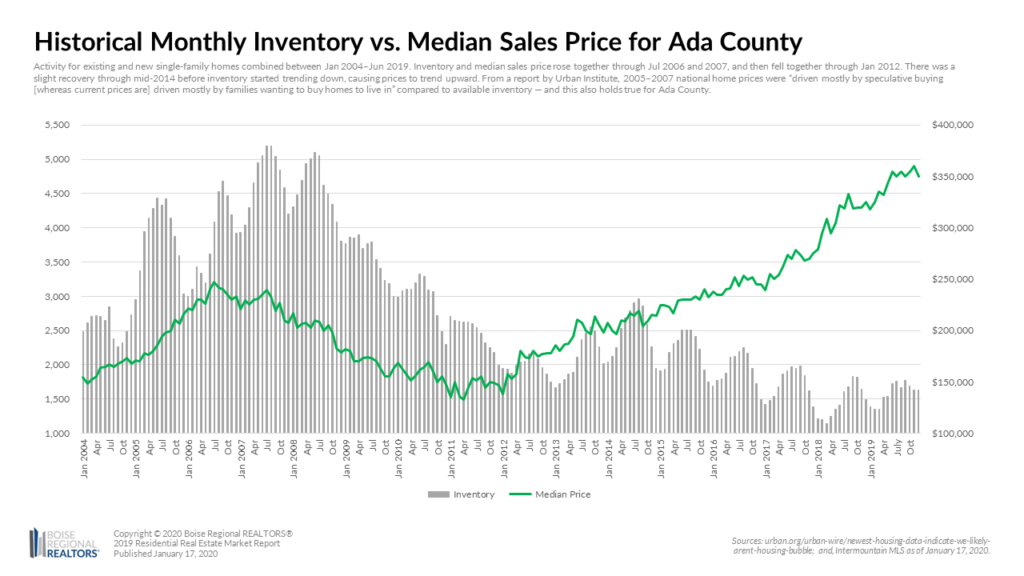
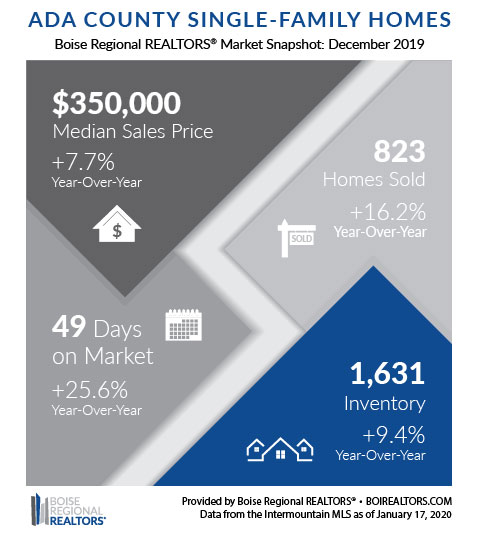
The median sales price for homes in Ada County was at $350,000 in December 2019, an increase of 7.7% over the same month in 2018. Adding December’s data to the annual calculation put the median sales price at $345,000 for 2019, an increase of 9.9% compared to last year.
The most recent monthly high point was in November 2019, when prices reached $359,900, and throughout 2019, the headlines have been focused on Ada County homes selling for more than ever — but what’s behind that trend?
For over four years, home prices were being driven up by a persistently low supply of lower-priced existing homes compared to demand, a greater share of new homes selling at overall higher prices, as well as increased purchase power from low mortgage rates.
January 2019 was the first time since October 2014 that the year-over-year number of existing homes for sale in Ada County increased, breaking the 51-month consecutive streak of year-over-year declines. But despite existing inventory increasing somewhat throughout the year, it was not enough to meet demand and home prices continued to climb.
Looking more closely at the November 2019 data, that month’s high median price point was due, in part, to an uptick in new construction sales year-over-year, which have been selling for $50,000-70,000 or more compared to the median prices for existing homes, pushing up the overall market price as a result. In fact, new home sales made up of 32.6% of all home sales 2019, an increase of 14.8% compared to 2018. We will monitor new construction throughout 2020, as it will continue to play a significant role in our local market and statistics.
While home prices have gone up, low mortgage rates have kept monthly mortgage payments relatively stable since 2012, and interestingly, much lower than they were during the previous peak in 2006 when rates were around 6.4%. As of January 2020, the rate for a 30-year fixed mortgage was at 3.6%, and many economists are expecting rates to stay below 4.0% throughout 2020.
Many organizations have also weighed in on what we could expect to see in the housing market and economy for 2020. The Washington Post summarized these forecasts nicely and provided this national take: “A strong job market and low mortgage rates should sustain the housing market in 2020. The problem will be finding enough homes for buyers. With unemployment hovering at a 50-year low and interest rates well below historical norms, the real estate industry is being dragged down by scarcity in housing stock, especially at lower price ranges. Not enough homes are being built, and homeowners are staying put longer, creating a bottleneck.”
From a more local perspective, REALTOR.com predicted Boise would be the top market in the country for price growth, due to job and population growth. The Idaho Press reported that 2019 was the ninth consecutive year of growth in Idaho’s labor market, and that a recession is unlikely in the next two years, although wages aren’t keeping up with the rising cost of living.
According to the Boise Valley Economic Partnership, the average annual wage of workers in the Boise Metro was $47,131 at the end of 2019, a 29.6% increase since 2010. This modest growth in wages has not been enough, though, to keep up with the rise in home prices. And despite help from low mortgage rates for some, more housing supply is needed to bring the housing market back into balance.
To bring our market back into balance, the Treasure Valley needs more inventory, particularly priced at or below $300,000, both in new construction and existing homes being listed for sale. That doesn’t mean more rooftops anywhere and everywhere, but comprehensive, regional planned growth, that offers adequate purchase and rental options in all price points — not only to stabilize the market but to preserve and improve the quality of life for all residents.
DECEMBER 2019 ELMORE COUNTY HOUSING MARKET UPDATE
Of the 527 homes sold in Elmore County in 2019, 510 were existing/resale closed sales, while 17 were new construction sales — an uptick from the 2 new construction homes sold in 2018.
New homes typically sell at higher price points, due to increases in costs of land, labor and construction materials, so this larger share of new construction sales has brought up the overall median sales price of homes in Elmore County to $194,900 year-to-date (January 1 – December 31, 2019), an increase of 18.1% over the same period in 2018.
Home prices were not the only increase seen in the Elmore County housing market last year —November 2019 was the first time in 57 months that Elmore County saw an increase in inventory year-over-year. This trend continued through December 2019, with 84 homes available for purchase at the end of the month, an increase of 55.6% compared to December 2018.
Despite the increase in inventory at the end of 2019, buyer demand continued to outpace supply as the months supply of inventory (MSI) in Elmore County was at 2.3 months, for all price points combined, at the end of December 2019.
MSI measures the relationship between inventory and buyer demand by taking the number of homes for sale (inventory) divided by the average number of closed sales by month for the preceding twelve months. The resulting number can be described as the number of months it would take to sell through all the available supply assuming no other homes came on the market.
A balanced market—not favoring buyers or sellers—is typically between 4-6 months of supply. Below four months typically favors sellers and more than six months typically favors buyers.
The uptick in inventory in Elmore County is welcome news as buyer demand is still high in the area. If you are looking to buy, work with your REALTOR® to explore some of the new options now available in your area
DECEMBER 2019 GEM COUNTY HOUSING MARKET UPDATE
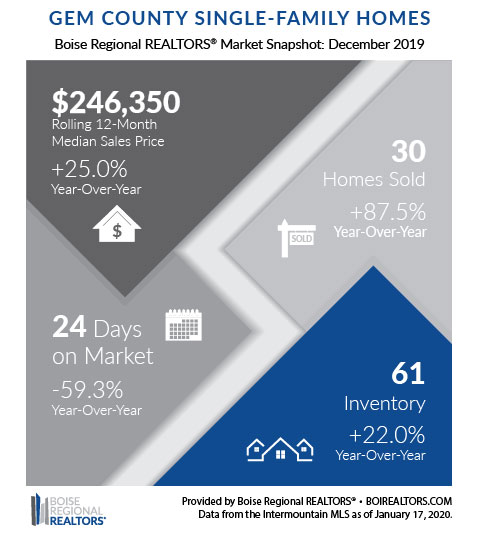
In 2019, Gem County’s overall median sales price ended at $245,000 year-to-date (January 1 – December 31, 2019), an increase of 22.6% over the same period in 2018.
Of the 285 homes sold in 2019, 249 were existing/resale closed sales, while 36 were new construction sales — a 44.0% increase in new construction sales from the year before.
New homes typically sell at higher price points, due to increases in costs of land, labor and construction materials, so this larger share of new construction sales has brought up the overall median sales price of homes in Gem County last year. Persistently low inventory compared to buyer demand is the other factor driving up the median sales price.
In December 2019, there were 41 pending sales in Gem County, an 87.5% increase compared to the year before. Pending sales measure the number of homes under contract that will close within the next 30-60 days. An increase here reflects the considerable buyer demand in Gem County.
Another way to measure the relationship between inventory and buyer demand is with “Months Supply of Inventory.” This metric takes the number of homes for sale (inventory) divided by the average number of closed sales by month for the preceding twelve months. The resulting number can be described as the number of months it would take to sell through all the available supply assuming no other homes came on the market.
A balanced market—not favoring buyers or sellers—is typically between 4-6 months of supply. Below four months typically favors sellers and more than six months typically favors buyers.
As of December 2019, the months supply of inventory in Gem County was at 2.2 months, for all price points combined. This is a decrease of 12.0% from December 2018, illustrating again the increasing demand for housing in the area.
Gem County experienced the same market conditions in 2019 that we’ve seen elsewhere in the Treasure Valley — higher home prices due to low inventory and more new construction sales. We’ll continue to keep an eye on prices, inventory, and months supply of inventory to see if the market is shifting more into balance in 2020.
RESOURCES:
Additional information about trends within the Boise Region, by price point, by existing and new construction, and by neighborhood, are now available here: Ada County, Elmore County, Gem County, and City Data Market Reports. Each includes an explanation of the metrics and notes on data sources and methodology.
Download the latest (print quality) market snapshot graphics for Ada County, Ada County Existing/Resale, Ada County New Construction, 2019 Ada County Year in Review, Elmore County, 2019 Elmore County Year in Review, Gem County, and 2019 Gem County Year in Review. Since Canyon County is not part of BRR’s jurisdiction, we don’t report on Canyon County market trends. Members can access Canyon County snapshots and reports in the Market Report email, or login to our Market Statistics page.
# # #
This report is provided by Boise Regional REALTORS® (BRR), a 501(c)(6) trade association, representing real estate professionals throughout the Boise region. Established in 1920, BRR is the largest local REALTOR® association in the state of Idaho, helping members achieve real estate success through ethics, professionalism, and connections. BRR has two wholly-owned subsidiaries, Intermountain MLS (IMLS) and the REALTORS® Community Foundation.
If you have questions about this report, please contact Cassie Zimmerman, Director of Communications for Boise Regional REALTORS®. If you are a consumer, please contact a REALTOR® to get the most current and accurate information specific to your situation.
The data reported is based primarily on the public statistics provided by the IMLS. These statistics are based upon information secured by the agent from the owner or their representative. The accuracy of this information, while deemed reliable, has not been verified and is not guaranteed. These statistics are not intended to represent the total number of properties sold in the counties or cities during the specified time period. The IMLS and BRR provide these statistics for purposes of general market analysis but make no representations as to past or future performance. The term “single-family homes” includes detached single-family homes with or without acreage, as classified in the IMLS. These numbers do not include activity for mobile homes, condominiums, townhomes, land, commercial, or multi-family properties (like apartment buildings).


