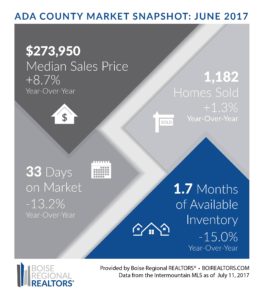
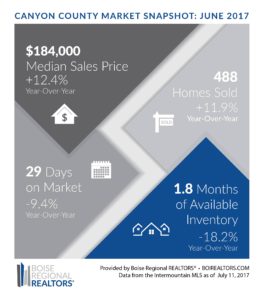
Ada County’s median sales price in June 2017 reached $273,950, an increase of 8.7% over June 2016. The median sales price in Canyon County reached $184,000 last month, an increase of 12.4% compared to last year. Both were record highs.
Three things continue to drive prices up in the Boise Region: consumer demand, lack of inventory, and higher-priced new construction — not market speculation as was common a decade ago.
To measure each of these market drivers, we took a deeper look at activity for pending sales, months supply of inventory, and the median sales price for new construction.
Pending Sales is a key indicator of consumer/homebuyer demand, counting the number of homes under contract that should close within 30-90 days. In June 2017, there were 1,854 pending sales in Ada County, up 7.5% from the previous year. In Canyon County, there were 750 pending sales, up 10.8% from the previous year. In both counties, the year-over-year increase in pending sales was primarily due to new construction as buyers are finding it harder to find existing inventory, especially in the lower price points.
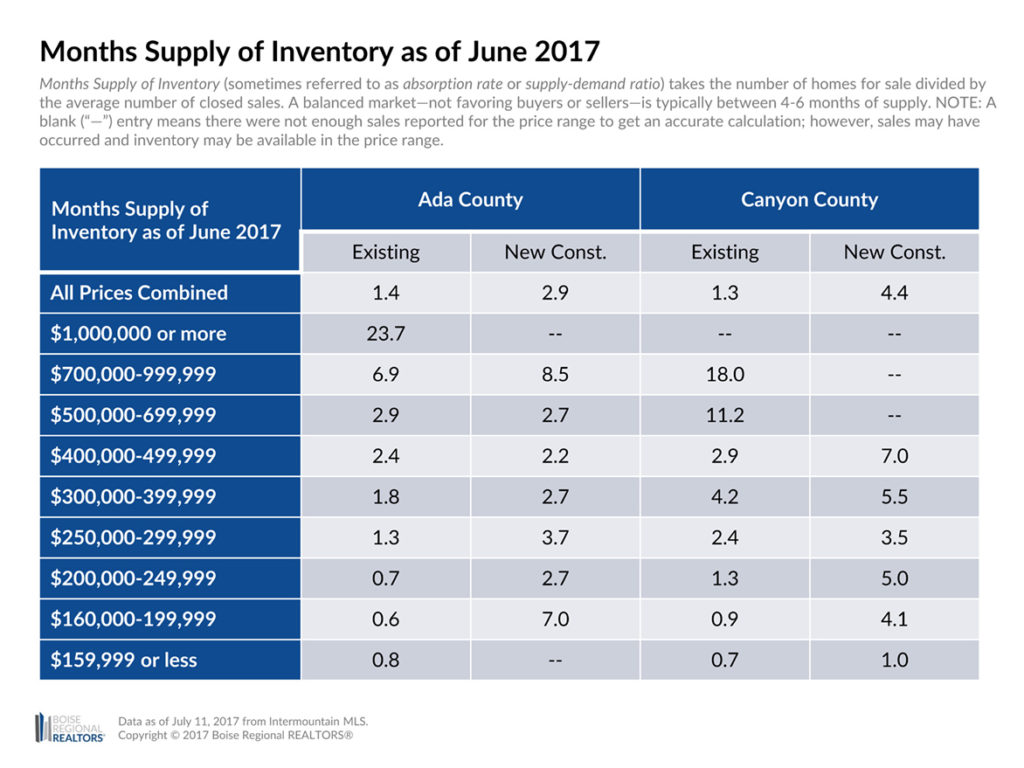
Months Supply of Inventory (sometimes referred to as absorption rate or supply-demand ratio) takes the number of homes for sale divided by the average number of closed sales. A balanced market—not favoring buyers or sellers—is typically between 4-6 months of supply.
In June 2017, the months supply of inventory for existing/resale and new construction combined was at 1.7 months in Ada County, down 15.0% from June 2016. Canyon County was at 1.8 months of inventory in June 2017, down 18.2% from the previous year. Here’s how that breaks down by each segment and by price point:
 June’s market data is indicating a more balanced new construction market in Canyon County, at 4.4 months of supply, an increase of 4.8% from last year. Also, buyers who prefer an existing home may have more luck in Canyon County, especially if they’re looking to purchase at $300,000 or above.
Ada County’s inventory for both existing and new lags behind demand in all price points, with a few exceptions: existing or new construction homes priced over $700,000, and at least in June 2017, new construction priced $160-$199,999, primarily in Kuna and Garden City.
Median Sales Price is the price at which half the homes sold for more, and half sold for less. Because more newly constructed homes are selling at higher price points, it’s bringing up the overall median price in both counties.
In June 2017, the median sales price for new homes in Ada County was $345,450, up 14.3% over June 2016. Further, 20.3% more new homes sold in June 2017 than June 2016. In Canyon County, the median sales price for new homes was $239,495, up 6.8% compared to last year, and 33.3% more new homes sold year-over-year.
For comparison, existing home sales in Ada County were down 3.5% year-over-year (due to fewer homes being available to purchase), and the median sales price was at $255,000, up 6.3% over June 2016. In Canyon County, existing home sales were up 8.9% and the median sales price was at $175,350, up 11.9% over June 2016.
Additional information about trends within each county, by price point, by existing and new construction, and by neighborhood, are now available in the June 2017 Market Report. This report includes an explanation of the metrics and notes on data sources and methodology.
Download the latest market snapshot graphics for Ada County and Canyon County:
# # #
This report is provided by the Ada County Association of REALTORS®, which began doing business as Boise Regional REALTORS® (BRR) in 2016. BRR is the largest local REALTOR® association in Idaho, with over 4,000 members and two wholly-owned subsidiaries — the Intermountain Multiple Listing Service, Inc. (IMLS) and the Boise Regional REALTORS® Foundation. This report is based primarily on the public statistics provided by the IMLS, available at: intermountainmls.com/Statistics/Static.aspx. These statistics are based upon information secured by the agent from the owner or their representative. The accuracy of this information, while deemed reliable, has not been verified and is not guaranteed. These statistics are not intended to represent the total number of properties sold in the counties or cities during the specified time period. The IMLS and BRR provide these statistics for purposes of general market analysis but make no representations as to past or future performance. || The term “single-family homes” includes detached single-family homes with or without acreage, as classified in the IMLS. These numbers do not include activity for mobile homes, condominiums, townhomes, land, commercial, or multi-family properties (like apartment buildings). If you are a consumer, please contact a REALTOR® to get the most current and accurate information specific to your situation.


