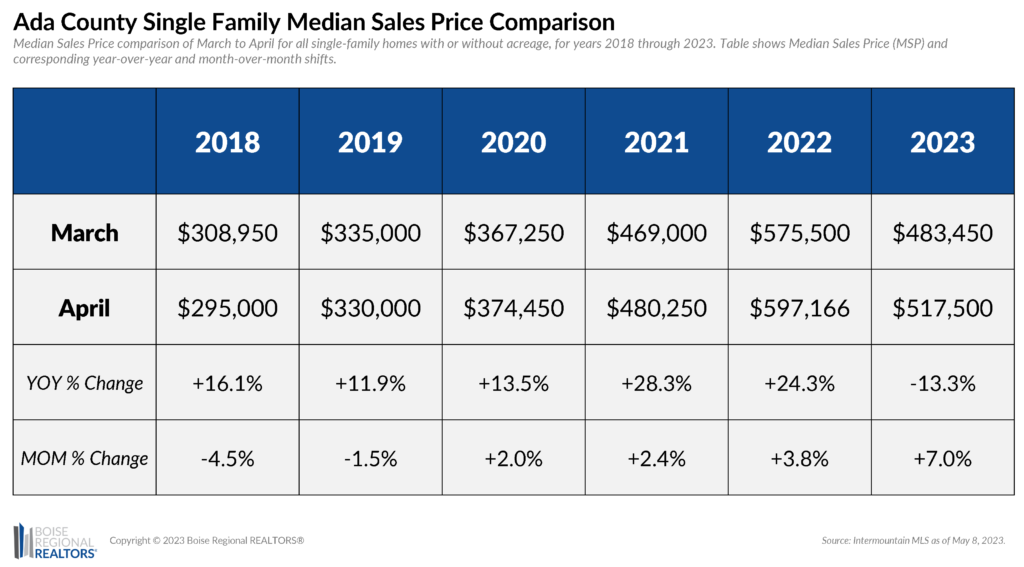
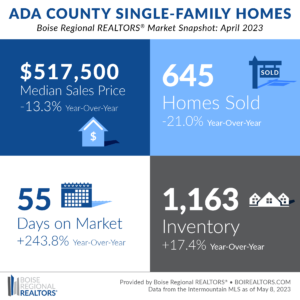
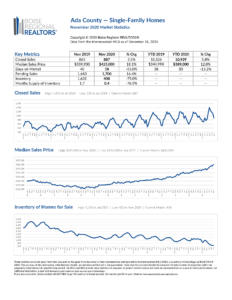
April 2023’s median sales price was $517,500, marking the sixth consecutive year-over-year drop but a $34,000 positive surge from last month. Historically, March to April has shown month-over-month shifts from -4.5% to +3.8%. This month’s 7.0% uptick is uncharacteristically hefty for the season and is the highest month-over-month increase we’ve seen in 19 weeks.
Forbes.com warns that housing market activity could be dampened by mortgage rate changes as it has been in other areas across the country already. Lowered purchasing hunger could result in lower prices, but their research anticipates a nationwide price decline is likely not in the cards. For example, Ada County’s price bump this month nudged the MSP to pre-winter range and will likely continue to rise if supply recovery dwindles.
April showed a significantly slimmer inventory accrual year-over-year at 17.4%. The last time we saw inventory accumulation at less than 20% was June 2021 — the edge of the “COVID market.” Since then, we had seen an average inventory growth of 112.4% with its highest peak reaching 192.9% in June of 2022.
Sales have cooled, as well, giving time for new listings to catch up with demand. There were 645 sales in Ada County, 398 of which were existing homes and 247 were new construction. April marked the fourteenth consecutive year-over-year reduction in sales at 21.0% — 13.1% less than March’s transactions.
Existing homes continue to be the hottest commodity in Ada County, spending an average of 31 days on the market — a surprising 138.5% increase from the same month last year but a 32.6% decrease compared to March of this year. The lurch in existing home sale speed matched the pace of late-summer last year. New construction’s DOM swelled by 287.5% from April 2022, bogging down to 93 days on market — a slight respite from the 106 days we saw last month.
New market landscapes may deter buyers from uprooting due to higher interest rates, but softened prices will ease the blow for those who need to move for life circumstances such as growing families and job relocation. NAR’s Chief Economist Lawrence Yun echoed the uniqueness of the market at this week’s Legislative Meetings in Washington D.C.; the tug-of-war continues between limited supply causing multiple-offer situations — currently 28% of transactions nationwide — and the need for lower prices to account for changes in mortgage rates.
Complications are exasperated by proposed LLPA changes which may affect affordability for some. We will continue to monitor developments on the changes and share them with BRR Members.
Down payment assistance programs and rate buy-down programs continue to be an asset to buyers who are hesitant due to recent mortgage rate changes. Whether consumers are purchasing their first home or upgrading to fit their current lifestyle, real estate remains a powerful long-term tool for their financial portfolio. We encourage consumers to connect with a REALTOR® and learn what programs may fit them best for a changing market — both as a buyer and a seller.
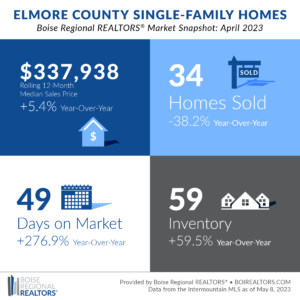
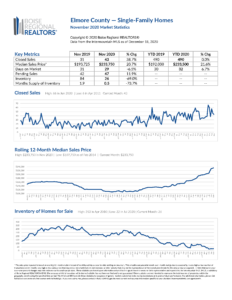
The rolling 12-month median sales price for Elmore County home sales was $337,938 in April 2023, a 5.4% increase from the year before but a mirror image of last month. Due to the smaller number of transactions that occur in the area, we use a rolling 12-month median sales price to get a better idea of the overall trends. Price growth has dwindled, though still positive, for the past 12 weeks.
Sales for April 2023 have continued to slant downward year-over-year since May 2022. With 34 closings last month, the number of home sales decreased 38.2% compared to the same month a year ago. Of those, 26 were existing/resale homes and 8 were newly constructed homes.
Year-over-year pending activity cooled, as well, marking the 14th consecutive month of declines. There were 47 pending sales — properties with an accepted offer that are expected to close within 30-60 days — a decrease of 9.6% compared to April 2022. While year-over-year comparisons remain in the negative, April exhibited positive month-over-month changes at 11.9%. This month marks the fifth of month-over-month climbs, consistent with seasonal accelerations.
Consumer confidence appears to be shaken from the rollercoaster that is mortgage rates. We saw sporadic moments of reprieve from hikes over the last six months, only to be bounced back to rates close to the 7.08% we saw October 2022 (currently hovering at 6.39%). The well-intended adjustments to rates by Feds have caused potential buyers to pause in hopes that another reprieve will come. However, Forbes.com argues the adjustments may not be enough to win the tug-of-war game with supply shortages and corresponding pressures on demand.
Down payment assistance programs and rate buy-down programs continue to be an asset to buyers who are hesitant due to recent mortgage rate changes. Whether consumers are purchasing their first home or upgrading to fit their current lifestyle, real estate remains a powerful long-term tool for their financial portfolio. We encourage consumers to connect with a REALTOR® and learn what programs may fit them best for a changing market — both as a buyer and a seller.
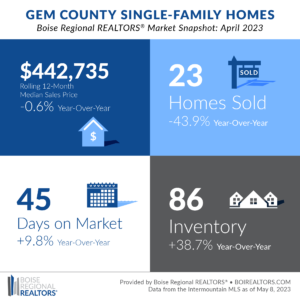
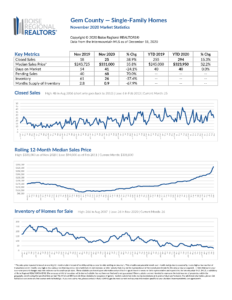
The rolling 12-month median sales price for Gem County home sales was $442,735 in April 2023, a 0.6% decrease from the year before. Due to the smaller number of transactions that occur in the area, we use a rolling 12-month median sales price to get a better idea of the overall trends. This month marks the first year-over-year drop in median sales price since May 2016. March 2023 showed a decrease in pending sales (down 44.6%) and increase in inventory (up 29.8%) which opened the door for April’s prices to ease.
Year-over-year trends for sales in Gem County have dropped again this month in comparison to the uncharacteristically high-volume in April 2022. Down 43.9% year-over-year, Gem’s sales this month totaled 23 homes — 14 resale and 9 new construction.
When comparing market speeds to the year prior, days on market seem unhurried (stretched by 4 days this month). Month-over-month shifts presented a far more impressive picture — cut nearly in half, days on market went from 82 days in March 2023 to 45 days in April 2023. Individual sectors experienced similar month-over-month changes: existing homes went from 80 days in March to 46 days in April and new construction shifted from 88 days to 43 days, respectively.
We’ve seen the first month-over-month bump in inventory since August 2022, mounting to 86 available homes for the month of April. Existing homes made the biggest leap, adding 22.5% more homes this month compared to the previous month for a total of 49 homes. New construction added 8.8% to their month-over-month inventory, equating to 37 available properties. Inventory for all sectors is up year-over-year, meaning buyers will have a larger selection to choose from and could point to further price decreases in the future.
Forbes.com remains skeptical that we’ll continue to see price drops as mortgage rate changes threaten to cool the market further. NAR’s Chief Economist Lawrence Yun echoed the unique nature of the market in his presentation during this week’s Legislative Meetings in Washington D.C. Yun noted that lower prices are still sought after but we continue to see multiple-offer situations which account for 28% of transactions nationwide. We will continue to monitor the effects mortgage rates and proposed LLPA changes in order to educate BRR Members on the resulting shifts in the market.
Additional information about trends within the Boise Region, by price point, by existing and new construction, and by neighborhood, are now available here: Ada County, Elmore County, Gem County, and Condos, Townhouses, and Mobile/Manufactured Homes Market Reports. Each includes an explanation of the metrics and notes on data sources and methodology.
Download the latest (print quality) market snapshot graphics for Ada County, Ada County Existing/Resale, Ada County New Construction, Elmore County, and Gem County. Since Canyon County is not part of BRR’s jurisdiction, we don’t publicly report on Canyon County market trends. Members can access Canyon County snapshots and reports in the Market Report email, or login to our Market Statistics page. Boise and Owyhee County snapshots can also be accessed on our Market Statistics page.
# # #
The data reported is based primarily on the public statistics provided by the Intermountain MLS (IMLS), a subsidiary of Boise Regional REALTORS® (BRR). These statistics are based upon information secured by the agent from the owner or their representative. The accuracy of this information, while deemed reliable, has not been verified and is not guaranteed. These statistics are not intended to represent the total number of properties sold in the counties or cities during the specified time period. The IMLS and BRR provide these statistics for purposes of general market analysis but make no representations as to past or future performance. If you have questions about this report, please contact BRR’s Director of Communications Taylor Gray at 208-947-7238. For notes on data sources, methodology, and explanation of metrics, visit boirealtors.com/notes-on-data-sources-and-methodology.
If you are a consumer, please contact a REALTOR® to get the most current and accurate information specific to your situation.
Boise Regional REALTORS® (BRR), a 501(c)(6) trade association, represents real estate professionals throughout the Boise region. Established in 1920, BRR is the largest local REALTOR® association in the state of Idaho, helping members achieve real estate success through ethics, professionalism, and connections. BRR has two wholly-owned subsidiaries, Intermountain MLS (IMLS) and the REALTORS® Community Foundation.
“REALTOR®” is a federally registered collective membership mark which identifies a real estate professional who is member of the National Association of REALTORS® (NAR) and subscribes to its strict Code of Ethics.

