Note: Last year, our April 2020 market report showed a nearly 20% drop in sales year-over-year in Ada County, a figure not seen since 2011. This did not come as a surprise as REALTORS® and consumers heeded the statewide stay-home order that was in place at that time, and as anticipated, sales rebounded as we moved through the phased re-opening plan. Since there will be stark fluctuations when comparing activity this year to last year, we will present any year-over-year comparisons with both 2020 and 2019 figures, where applicable, but focus on month-over-month changes in the next few reports.
+++
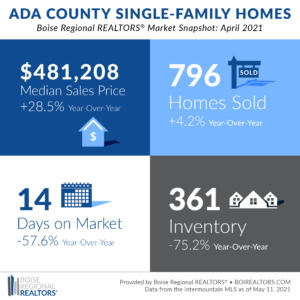
The speed at which Ada County homes went under contract accelerated in April 2021 as the average number of days between when a home was listed for sale and an offer was accepted dropped to a record low of 14 — 36.4% faster than in March 2021. Existing homes had accepted offers within an average of just 10 days — 28.6% faster than last month.
The fast pace of the market was due to the insufficient supply of homes for sale compared to buyer demand. This imbalance in supply versus demand, as well as the fact that nearly 70% of buyers of existing/resale homes paid more than the list price last month, put upward pressure on home prices. The median sales price in April reached a record $489,000 for existing/resale homes — up 2.8% from March 2021.
Another factor impacting price was the historically low mortgage rates, which enabled some buyers to purchase at these higher price points, or, allowed them to increase their offers to be more competitive. In April 2021, the 30-year fixed rate was at 3.1%, on average, compared to 3.3% in April 2020 and 4.1% in April 2019.
As more homes sell above the listed price, many sellers rely on research provided by their REALTOR® to set the price initially and what they will accept.
REALTORS® offer sellers guidance when it comes to setting their list price by comparing similar homes that recently sold nearby or are currently on the market, making adjustments for square footage, upgrades, amenities, location, and so on. Your agent might suggest various pricing strategies to ensure the home is listed within common price range searches to get in front of more buyers, or, suggest a price below similar market comparables to encourage more offers, which often results in higher sales-to-list price ratios, or multiple offer situations.
Ultimately, the decision on what the property will be listed for is made by the seller based on their goals, and the sold price is determined by what buyers are willing to pay.
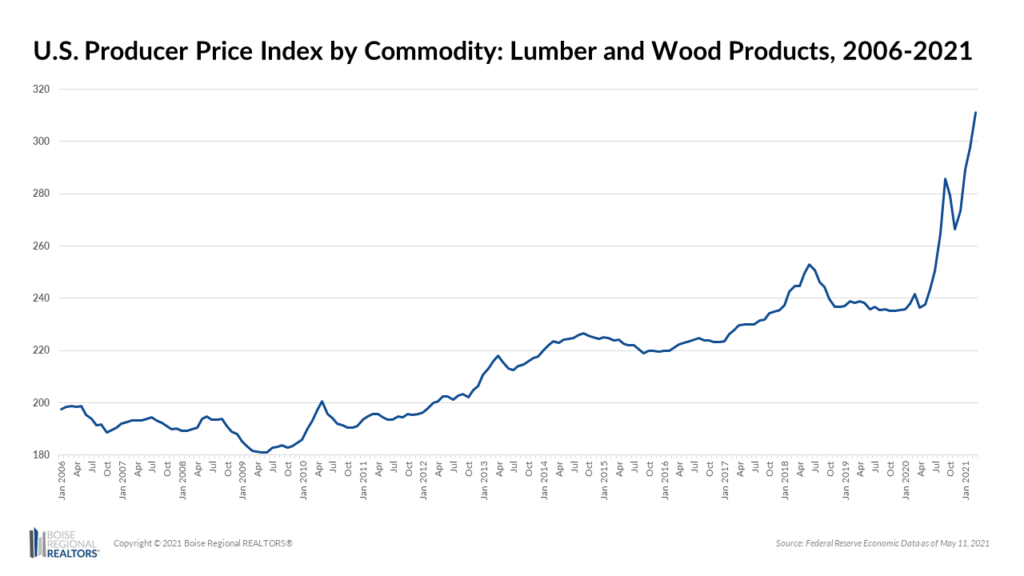
New construction home prices also reached a median sales price record of $469,900 in April 2021 — an increase of 1.9% from March 2021. In addition to buyer demand, prices for new homes reflect the ever-increasing cost of materials, especially lumber. Using the most recent data available, through March 2021, the national price of lumber and wood products increased by 28.8% since 2020, and by 30.5% since 2019.
These costs are being passed along to homebuyers, and due to the uncertainty in the availability and price of materials, some builders are holding back available inventory until they are closer to delivery so they can price the property based on the actual build cost.
But because some prospective sellers are also holding back existing homes from the market — sometimes due to concerns over COVID-19, but more often so they can find their next home before listing their current one — the extreme lack of existing supply has made new homes less expensive, on average, than existing homes for the past three months.
These unprecedented trends of new homes selling for less than existing homes, the willingness of buyers to pay over list price, and the record fast market times illustrate the incredible demand we’ve been experiencing, driven by low rates and insufficient supply.
One trend we hope to see continue was the uptick in inventory between March and April. The number of homes for sale was up 22.4% month-over-month with 361 homes available at the end of April. Additionally, another 671 homes became available and went under contract during the month, for existing and new construction combined. While the market is moving fast, these figures show that inventory is available.
If you’re considering selling, reach out to a REALTOR® today to get current and hyper-local research to guide your list price decisions and to expose your home to the widest pool of potential buyers through the multiple listing service.
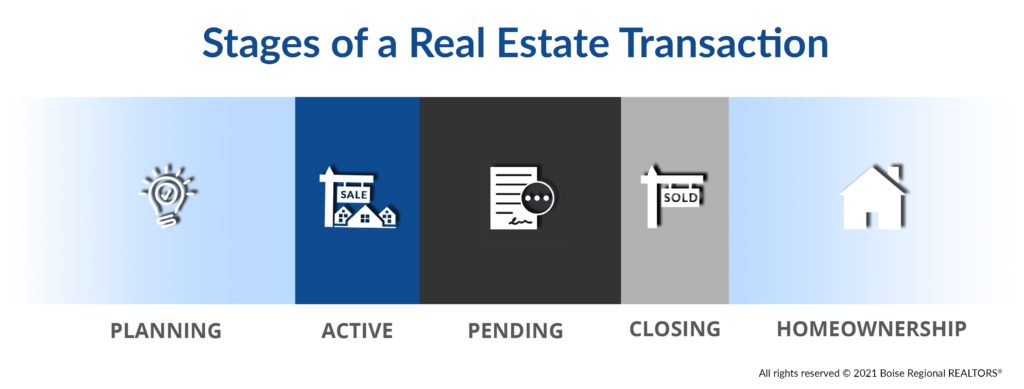
In each of our reports in 2021, BRR is focusing on the various phases of a real estate transaction to help consumers be prepared before, during, and after a real estate transaction, showing them what their REALTOR® will be doing for them along every step, and the key data points they can look for to make sense of the market. To find a REALTOR®, please visit realtor.com/realestateagents.
Note: This time last year, there were declines in home sales as REALTORS® and consumers heeded the statewide stay-home order that was in place. Since there may be stark fluctuations when comparing activity this year to last year, we will present any year-over-year comparisons with both 2020 and 2019 figures, where applicable.
+++
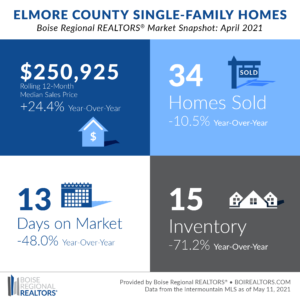
There were 34 closed sales in Elmore County last month — a decrease of 10.5% compared to April 2021, but up 21.4% compared to April 2019. Of those sales, 31 were existing/resale homes, and three were new homes.
The homes that sold in April didn’t spend long on the market — the average number of days between when a home was listed for sale and received an offer to purchase was 13 — 48.0% faster than in April 2020 and 53.6% faster than in April 2019. Existing homes had accepted offers within an average of just 11 days — 45.0% faster than the year before and 62.1% faster than the same month in 2019.
The fast pace of the market was due to the insufficient supply of homes for sale compared to buyer demand, putting upward pressure on prices. In April 2021, the median sales price for homes in Elmore County reached $250,925, an increase of 24.4% compared to the same time last year. Due to the smaller number of transactions that occur in the area, we use a rolling 12-month median sales price to get a better idea of the overall trends.
Another factor impacting price was the historically low mortgage rates, which enabled some buyers to purchase at these higher price points, or, allowed them to increase their offers to be more competitive. In April 2021, the 30-year fixed rate was at 3.1%, on average, compared to 3.3% in April 2020 and 4.1% in April 2019.
With consistent demand for homes and the recent rise in sales prices, sellers are realizing great values for their homes. Your REALTOR® can provide you with valuable research based on recently sold and currently active properties that can help guide your pricing strategy.
On the flip side, buyers are finding that working with a REALTOR® is imperative in today’s competitive market, giving them an edge in crafting strong offers and negotiating multiple offer situations.
Note: This time last year, housing statistics were outside of the norm as REALTORS® and consumers heeded the statewide stay-home order that was in place. Since there may be stark fluctuations when comparing activity this year to last year, we will present any year-over-year comparisons with both 2020 and 2019 figures, where applicable.
+++
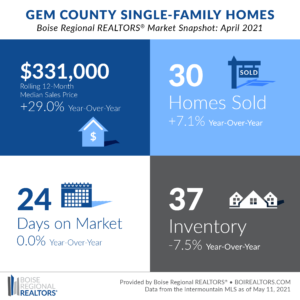
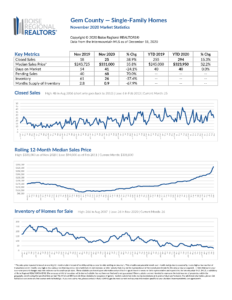
Demand for homes in Gem County remained high in April, as indicated by the number of sales and pending sales for the month. There were 30 closed sales last month — an increase of 7.1% compared to April 2020 and an increase of 3.4% when compared to April 2019. Of those sales, 20 were existing/resale homes, and 10 were new homes.
Homes under contract, also called “pending sales,” are properties with an accepted offer that should close within 30-90 days. In April 2021, there were 76 pending sales, an increase of 85.4% over April 2020 and 81.0% higher than in April 2019.
The homes that sold in April didn’t spend long on the market — the average number of days between when a home was listed for sale and received an offer to purchase was 24 — no change from April 2020, but 44.2% faster than in April 2019. Existing homes had accepted offers within an average of just 14 days — 48.1% faster than the year before and 64.1% faster than the same month in 2019.
The fast pace of the market was due to the insufficient supply of homes for sale compared to buyer demand, putting upward pressure on prices. In April 2021, the median sales price for homes in Gem County reached $331,000, an increase of 29.0% compared to the same time last year. Due to the smaller number of transactions that occur in the area, we use a rolling 12-month median sales price to get a better idea of the overall trends.
Another factor impacting price was the historically low mortgage rates, which enabled some buyers to purchase at these higher price points, or, allowed them to increase their offers to be more competitive. In April 2021, the 30-year fixed rate was at 3.1%, on average, compared to 3.3% in April 2020 and 4.1% in April 2019.
With consistent demand for homes and the recent rise in sales prices, sellers are realizing great values for their homes. Your REALTOR® can provide you with valuable research based on recently sold and currently active properties that can help guide your pricing strategy.
Wills went on to add that, “on the flip side, buyers are finding that working with a REALTOR® is imperative in today’s competitive market, giving them an edge in crafting strong offers and negotiating multiple offer situations.”
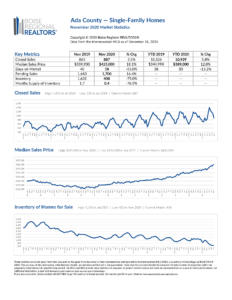
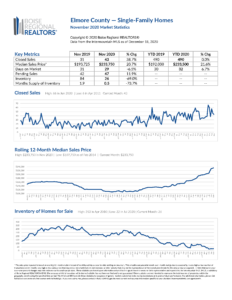
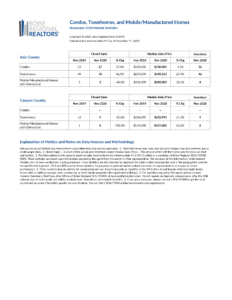
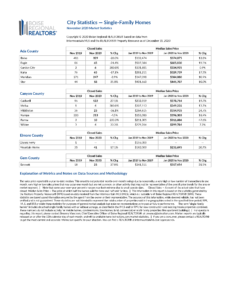
Additional information about trends within the Boise Region, by price point, by existing and new construction, and by neighborhood, are now available here: Ada County, Elmore County, Gem County, City Statistics, and Condos, Townhouses, and Mobile/Manufactured Homes Market Reports. Each includes an explanation of the metrics and notes on data sources and methodology.
Download the latest (print quality) market snapshot graphics for Ada County, Ada County Existing/Resale, Ada County New Construction, Elmore County, and Gem County. Since Canyon County is not part of BRR’s jurisdiction, we don’t publicly report on Canyon County market trends. Members can access Canyon County snapshots and reports as well as weekly snapshots in the Market Report email, or login to our Market Statistics page.
In addition to the market reports and analysis BRR sends members each month, we send press releases to local media contacts in order to promote the local market expertise that REALTORS® bring to every transaction. BRR’s market report data and/or interviews are featured in the following articles. Feel free to share with your clients, adding your own analysis and comments.
- Median home prices continue to climb in Ada & Canyon; 2C median nears $400,000 from BoiseDev
- More houses come on the inflamed Boise-area market. That’s little comfort for buyers from the Idaho Statesman
- The median price of a home in Canyon County is nearly $400,000 from Idaho Press
# # #
Boise Regional REALTORS® has a variety of resources about mortgage assistance, unemployment assistance, how to avoid scams, and more, under the Resources for Property Owners and Resources for Renters sections of BRR’s Coronavirus Response website.
This report is provided by Boise Regional REALTORS® (BRR), a 501(c)(6) trade association, representing real estate professionals throughout the Boise region. Established in 1920, BRR is the largest local REALTOR® association in the state of Idaho, helping members achieve real estate success through ethics, professionalism, and connections. BRR has two wholly-owned subsidiaries, Intermountain MLS (IMLS) and the boirealtors.com/connect/foundation/.
If you have questions about this report, please contact Cassie Zimmerman, Director of Communications for Boise Regional REALTORS®. If you are a consumer, please contact a REALTOR® to get the most current and accurate information specific to your situation.
The data reported is based primarily on the public statistics provided by the IMLS. These statistics are based upon information secured by the agent from the owner or their representative. The accuracy of this information, while deemed reliable, has not been verified and is not guaranteed. These statistics are not intended to represent the total number of properties sold in the counties or cities during the specified time period. The IMLS and BRR provide these statistics for purposes of general market analysis but make no representations as to past or future performance.
REALTOR® is a federally registered collective membership mark which identifies a real estate professional who is member of the National Association of REALTORS® and subscribes to its strict Code of Ethics.

