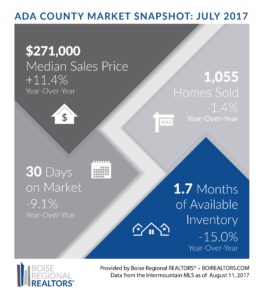
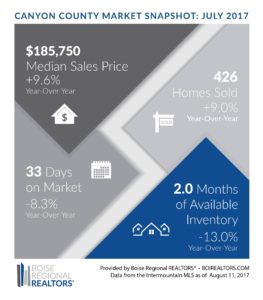
At Boise Regional REALTORS® (BRR), we feel like we’ve been talking about low inventory for months… and for good reason.
A few weeks ago, Zillow’s Chief Economist Svenja Gudell posted on Twitter: “Inventory down YoY for 25 consecutive months now. We’re just past 2-years into the #inventorycrisis.” While we never like when the term “crisis” is used to describe the housing market, the sentiment reflects the pressure that many home buyers are feeling caused by the low inventory levels, especially for existing homes.
[bctt tweet=”Ada and Canyon County Housing Inventory Down for 34 Consecutive Months”]
Gudell’s comments were based on nationwide trends, so what does this look like in the Boise Region?
Based on monthly data, inventory of existing homes in both Ada and Canyon counties has been down year-over-year for 34 consecutive months, starting October 2014. Let’s break this down by inventory (supply) and pending sales (demand)…
| Metrics | Ada Existing | Canyon Existing | ||||
| Oct-14 | Jul-17 | % Chg | Oct-14 | Jul-17 | % Chg | |
| Inventory (Supply) | 1,702 | 1,238 | -27.3% | 886 | 600 | -32.3% |
| Pending (Demand) | 628 | 1,078 | +71.7% | 307 | 537 | +76.6% |
| Months Supply of Inventory | 3.2 | 1.4 | -56.3% | 3.3 | 1.5 | -54.5% |
Inventory of existing homes in Ada County was at 1,702 in October 2014 and 1,238 in July 2017, a decrease of 27.3%. In comparison, there were 628 pending sales in October 2014 versus 1,078 in July 2017, an increase of 71.7%. Pending sales are homes under contract that should close within 30-90 days.
Looking at months supply of existing inventory — which takes the number of homes for sale divided by the average number of sales by month — there were 3.2 months in October 2014 in Ada County to 1.4 months in July 2017, a drop of 56.3%. (A balanced market—not favoring buyers or sellers—is typically between 4-6 months supply of inventory.)
In Canyon County, inventory of existing homes was at 886 in October 2014 and 600 in July 2017, a decrease of 32.3%. In comparison, there were 307 pending sales in October 2014 versus 537 in July 2017, an increase of 76.6%. That put months supply of inventory at 3.3 months in October 2014 compared to 1.5 months in June 2017, a drop of 54.5%.
How has the decrease in supply and increase in demand influenced home prices in the Boise Region? The median sales price of existing homes in Ada County increased 34.2% between October 2014 and July 2017, and increased 42.2% in Canyon County during that same period, illustrating BRR’s familiar refrain of how home prices are being driven by demand compared to supply.
Additional information about trends within each county, by price point, by existing and new construction, and by neighborhood, are now available in the July 2017 Market Report. This report includes an explanation of the metrics and notes on data sources and methodology.
Download the latest market snapshot graphics for Ada County and Canyon County:
# # #
This report is provided by the Ada County Association of REALTORS®, which began doing business as Boise Regional REALTORS® (BRR) in 2016. BRR is the largest local REALTOR® association in Idaho, with over 4,000 members and two wholly-owned subsidiaries — the Intermountain Multiple Listing Service, Inc. (IMLS) and the Boise Regional REALTORS® Foundation. This report is based primarily on the public statistics provided by the IMLS, available at: intermountainmls.com/Statistics/Static.aspx. These statistics are based upon information secured by the agent from the owner or their representative. The accuracy of this information, while deemed reliable, has not been verified and is not guaranteed. These statistics are not intended to represent the total number of properties sold in the counties or cities during the specified time period. The IMLS and BRR provide these statistics for purposes of general market analysis but make no representations as to past or future performance. || The term “single-family homes” includes detached single-family homes with or without acreage, as classified in the IMLS. These numbers do not include activity for mobile homes, condominiums, townhomes, land, commercial, or multi-family properties (like apartment buildings). If you are a consumer, please contact a REALTOR® to get the most current and accurate information specific to your situation.


