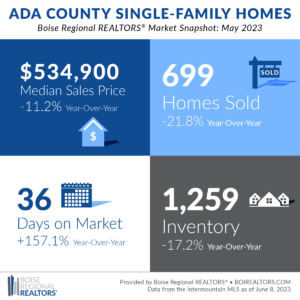
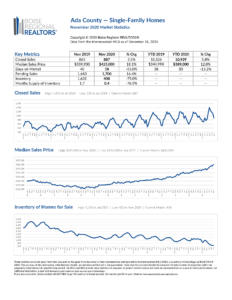
The median sales price in May 2023 ebbed 10.9% compared to May 2022, landing at $534,900 — a $17,400 boost from last month. A breakdown of homes sold in various price ranges highlighted an increased interest in homes between $250,000 and $500,000, leading to a lower median sales price for the month. Mortgage rate hikes over the past year also may have contributed to lower sales prices.
Existing homes faced the largest adjustment in median sales prices this month, bogging by $75,000. The 12.8% fade to the resale sector is slightly steeper than we’ve seen in past months, historically dipping from 2-14% year-over-year since September 2022. New construction welcomed a smaller reduction at 5.1% compared to the 10-20% we had seen year-over-year since January 2023.
There were 1,259 single-family homes available in Ada County in May, a reduction of 17.2% compared to the same month last year. This is the first year-over-year decrease in inventory we’ve seen since June 2021. Resale home options decreased by 22.2% while new construction choices slid by 9.9% compared to May 2022.
According to market highlights released by NAR on June 8th, the US housing market remains shy of 300,000 affordable homes for middle-income families. Boise was listed as one of the metro areas with the fewest affordable homes available for middle-income buyers. Five years ago, the income group was able to afford half of all available homes but that number has shrunk to 23%.
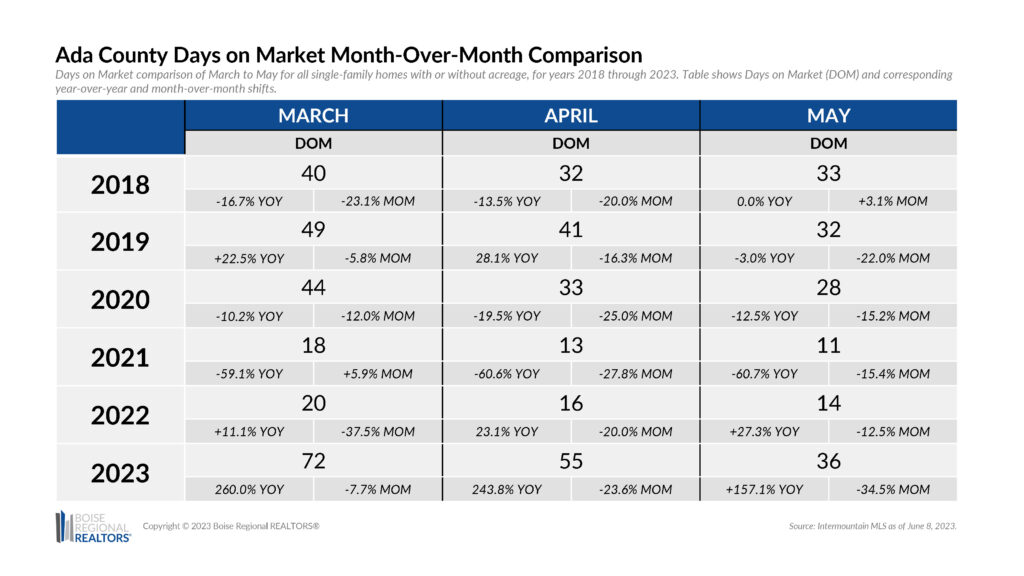
This month’s accelerated market speeds threaten to lower inventory moving into summer months. Comparisons for all sectors remain extended year-over-year, but single-family homes went under contract 19 days faster than the month before for a total of 36 days on market. New construction experienced the greatest shift month-over-month, shortening from 93 days in April 2023 to 66 days this month, while existing homes’ days on market depleted by 7 days. These hastened speeds have brought us back to pre-COVID market times, as shown in the chart below:
While shrinking inventory continues to pose supply issues with the increased market speeds, sales have trickled to 699 closings for the month. This is the fewest number of sales we’ve seen for the month of May since 2012.
The low quantity may largely be due to this month’s starting point. Since 2020, we’ve seen April to May month-over-month shifts of approximately 9-10%. This month, inventory still swelled by 8.3% compared to last month, meaning our market trajectory remains similar to past years. With fewer available homes, the bog in sales should help keep supply versus demand from tipping further for upcoming months.
Tackling supply issues will be a large factor in easing affordability concerns in our area. Builders will carry the torch for ensuring we can provide more options for middle-income families. This is echoed by National Association of Home Builders Chief Economist, Robert Dietz, who stated that the best long-term combatant to affordability concerns is to increase inventory, particularly with new construction.
With that said, there are many options out there for assisting those who are looking to buy now — a REALTOR® can help you find the program that best fits your situation.
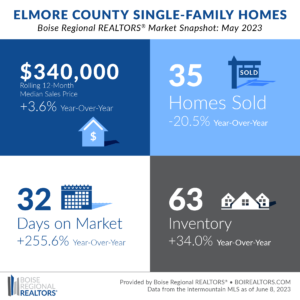
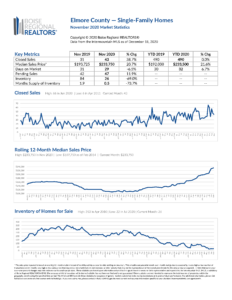
The rolling 12-month median sales price for Elmore County home sales was $340,000 in May 2023, a 3.6% increase from May 2022 and almost a $2,000 hike from last month. Due to the smaller number of transactions that occur in the area, we use a rolling 12-month median sales price to get a better idea of the overall trends. Price growth has dwindled, though still positive, for the past 13 weeks.
Existing homes accounted for over 75% of available inventory, equaling 49 of 63 homes. The remaining 14 homes were new construction. Historically, resale is the leader for market options in Elmore County, rarely dipping below 50% of available homes. Single-family inventory spiked 34.0% compared to May 2022, existing homes rose by 22.5%, and new construction doubled.
May marked the first positive trend in pending sales since February 2022, breaking a 14-week streak. New construction took the lead in year-over-year comparisons at 18.2% with 14 pending homes for the month. Existing homes waned by 2.2% compared to May 2022 but increased by 2.3% from April 2023.
Consistent with Ada County’s market behavior, Elmore experienced an acceleration of days on market from 49 days last month to 32 days this month — a 34.7% month-over-month decrease and 255.6% year-over-year increase. The 34 resale homes sold in Elmore stayed on the market for an average of 33 days while the solo new construction sale only lasted 6 days before going under contract.
As the summer market warms, supply versus demand may continue to put pressure on affordability. Bringing in fresh inventory will help combat demand and ease prices for buyers, offsetting recent bumps in mortgage rates. In the meantime, a REALTOR® can provide details for down-payment and affordability assistance programs for buyers looking to make a long-term investment.
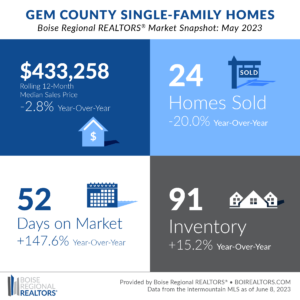
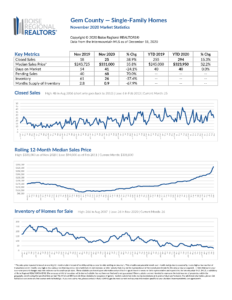
The rolling 12-month median sales price for Gem County home sales was $433,258 in May 2023, a 2.8% decrease from the year before and $9,477 reduction from last month. Due to the smaller number of transactions that occur in the area, we use a rolling 12-month median sales price to get a better idea of the overall trends. May marked the second consecutive month of slides, compared to the increases seen since May 2016.
Options continue to become available with single-family inventory rising to 91 homes, an increase of 15.2% year-over-year. Specifically, existing homes peaked by 50.0% compared to May 2022 (totaling 57 homes) while new construction bogged by 17.1% for a total of 34 available homes.
All single family, existing, and new construction homes are staying on the market longer this month with days on market stretching by 147.6% to 52 days, 210.0% to 31 days, and 102.3% to 87 days, respectively. It is important to note that this month’s days on market are being compared to uncharacteristically speedy metrics from May 2022. For example, existing homes faced the largest slow-down and still spent a mere 31 days on the market before going under contract in comparison to 10 days in May 2022.
Sales for the month slumped by 20.0% year-over-year, in contrast to the spike in pending contracts we saw for the month. Single-family pendings hiked by 3.9% and existing homes rose by 34.8%. New construction was the only sector to have year-over-year losses of 21.4% but still improved by 15.8% month-over-month.
Gem County is edging closer to a balanced market — a market that doesn’t favor buyers or sellers — with its month’s supply of inventory landing at 3.6 months. As inventory moves toward a balanced 4-6 month’s supply of inventory, we should continue to see sales prices ease. Buyers and sellers can connect with a REALTOR® to leverage programs that best fit their situations whether it be down-payment assistance or marketing techniques.
Additional information about trends within the Boise Region, by price point, by existing and new construction, and by neighborhood, are now available here: Ada County, Elmore County, Gem County, and Condos, Townhouses, and Mobile/Manufactured Homes Market Reports. Each includes an explanation of the metrics and notes on data sources and methodology.
Download the latest (print quality) market snapshot graphics for Ada County, Ada County Existing/Resale, Ada County New Construction, Elmore County, and Gem County. Since Canyon County is not part of BRR’s jurisdiction, we don’t publicly report on Canyon County market trends. Members can access Canyon County snapshots and reports in the Market Report email, or login to our Market Statistics page. Boise and Owyhee County snapshots can also be accessed on our Market Statistics page.
# # #
The data reported is based primarily on the public statistics provided by the Intermountain MLS (IMLS), a subsidiary of Boise Regional REALTORS® (BRR). These statistics are based upon information secured by the agent from the owner or their representative. The accuracy of this information, while deemed reliable, has not been verified and is not guaranteed. These statistics are not intended to represent the total number of properties sold in the counties or cities during the specified time period. The IMLS and BRR provide these statistics for purposes of general market analysis but make no representations as to past or future performance. If you have questions about this report, please contact BRR’s Director of Communications Taylor Gray at 208-947-7238. For notes on data sources, methodology, and explanation of metrics, visit boirealtors.com/notes-on-data-sources-and-methodology.
If you are a consumer, please contact a REALTOR® to get the most current and accurate information specific to your situation.
Boise Regional REALTORS® (BRR), a 501(c)(6) trade association, represents real estate professionals throughout the Boise region. Established in 1920, BRR is the largest local REALTOR® association in the state of Idaho, helping members achieve real estate success through ethics, professionalism, and connections. BRR has two wholly-owned subsidiaries, Intermountain MLS (IMLS) and the REALTORS® Community Foundation.
“REALTOR®” is a federally registered collective membership mark which identifies a real estate professional who is member of the National Association of REALTORS® (NAR) and subscribes to its strict Code of Ethics.

