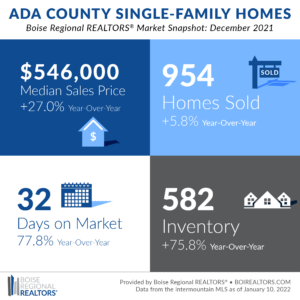
When summing up the 2021 Ada County housing market, one could easily argue that this past year brought the most fast-paced market we’ve ever seen, particularly in the first half of the year. The market conditions were incredibly competitive.
The county has faced limited housing inventory for years now, a phenomenon we’ve detailed in many of our reports. This lack of supply has been insufficient compared to the persistent demand for housing, which has driven up prices and caused a home buying frenzy earlier this year. We tracked the pace of the market by a few metrics — how quickly homes went under contract, the share of sales that sold over list price, and for how much they sold over list price.
We’ll first explore the data for each of these metrics in the existing home sale segment to illustrate just how competitive the market was in 2021.
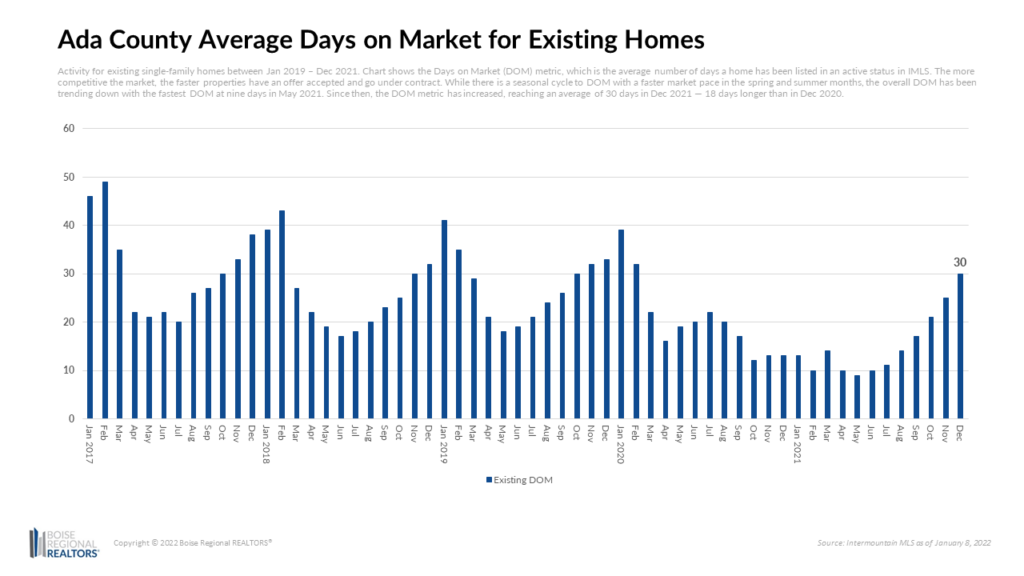
The Days on Market (DOM) metric measures the time between when a property is listed and when it has an accepted offer. Overall, DOM for existing homes trended down, reaching a historic low of just nine days in May 2021. Since then, the DOM metric has increased and normalized, reaching an average of 30 days in December 2021 — 18 days longer than in December 2020, and more in line with pre-pandemic levels from early 2020.
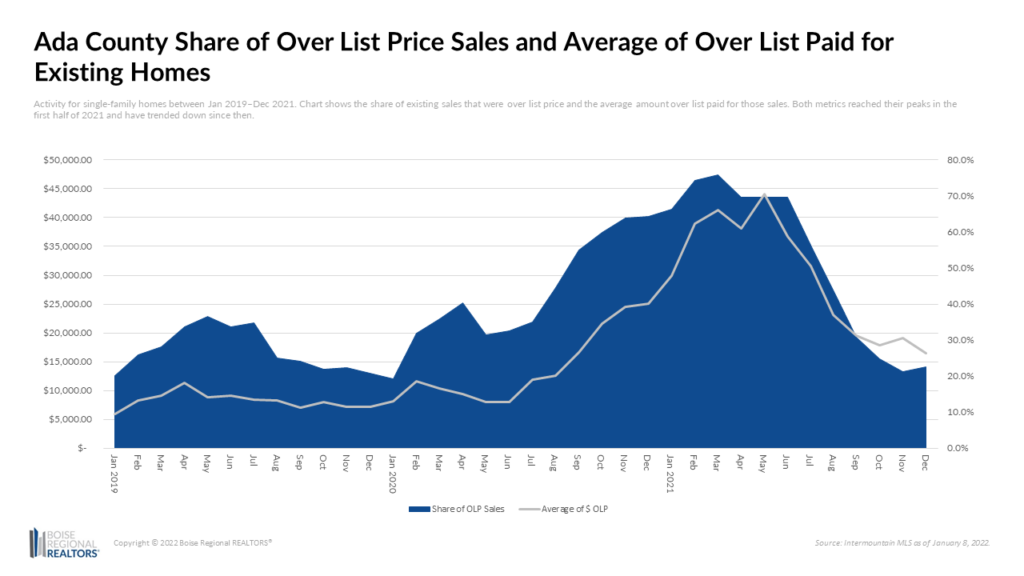
Not only were existing homes selling at a faster rate, but a larger share of total sales sold for more than their asking price, usually the result of multiple offer situations. The share of homes that sold over list price passed 50.0% in September 2020 and reached a peak of 75.9% in March 2021. By December 2021, it dropped to 22.6%, possibly indicating that list prices have become more aligned with what buyers are willing or able to pay.
But how much over asking did buyers pay in 2021, on average? As the share of over list sales went up, so did the amounts paid over asking. In May 2021, 69.7% of existing homes sold were for over list price, with an average premium of $44,075, the highest we’ve seen (going back to 2006 based on our existing dataset). The average amount paid over list has dipped since then, coming in at $16,487 in December 2021.
Unsurprisingly, with tight competition for existing homes and so many buyers willing to pay over list, the impact on prices was significant. The median sales price for existing homes was $510,000 in December 2021, up 21.4% compared to a year ago. The year-to-date median sales price was $505,000, a 34.7% increase compared to 2020, and the largest annual gain since we began tracking this data in 2006.
The new construction segment also saw year-over-year price jumps, largely due to increasing costs of land, labor, and materials — as well as the ongoing impact of pandemic-related shutdowns that continue to create delays in increase costs in the global supply chain. (Read more about this in our November report.) In December, the median sales price for new homes was $579,990, a 30.4% increase compared to December 2020. The year-to-date median sales price in 2021 for new construction was $525,000, a 23.1% increase over the previous year.
While homes have continued to sell at higher prices, interestingly, sales have dipped in recent months, and more notably so when comparing data year-over-year. In 2021, there were 10,855 home sales (new and existing combined) a decline of 11.8% compared to 2020 and the lowest number of total annual home sales for the county since 2017.
How can one of the fastest growing metros in the U.S. with a persistent demand for housing have declining home sales? The data provides a few clues.
First, buyers can’t buy homes that aren’t there, so limited inventory has definitely limited sales. This is especially true at the lower price points where buyer demand is most acute and inventory is hardest to come by. While inventory has ticked up over the last six months, the slim 0.7 Months Supply Inventory in December is still a far cry from the 4-6 months needed for a balanced market.
When year-over-year home sales are broken out by segment, there was a 6.7% decline in existing home sales and a 21.7% decline in new construction sales. One reason there may be fewer new construction sales could be because buyers are having to wait longer to move into their new homes. The average number of days between when a home goes under contract and when it closes was at 106 days in 2021, 30 days longer than in 2020, limiting the number of closings that can take place within the year and possibly leading some new home buyers to opt for an existing home with a quicker move-in date.
Much to the relief of buyers, we saw more normal market times and increases in inventory in the last few months of 2021. However, we’re still a long way from a balanced market and we hope more homeowners are able to realize the great values for their properties by listing in the coming months.
Whether you’re looking to buy or sell, it’s never been more important to work with a REALTOR®. They will help identify potential options for purchase, connect you with a mortgage lender, help craft a competitive offer, and negotiate on your behalf, allowing you to make decisions confidently and quickly to achieve your real estate goals.
Other notable statistics from December 2021:
- The overall median sales price (existing and new construction combined) in December 2021 was $546,000, a new record high. This is likely due to the large share (35.1%) of the typically higher priced new construction home sales that closed in December.
- There were 582 homes available at the end of the month — 75.8% more than in December 2020.
- As mentioned in the release, the overall (new and existing combined) Months Supply Inventory was 0.7 months. For the existing segment, it was 0.5 months, or approximately two weeks.
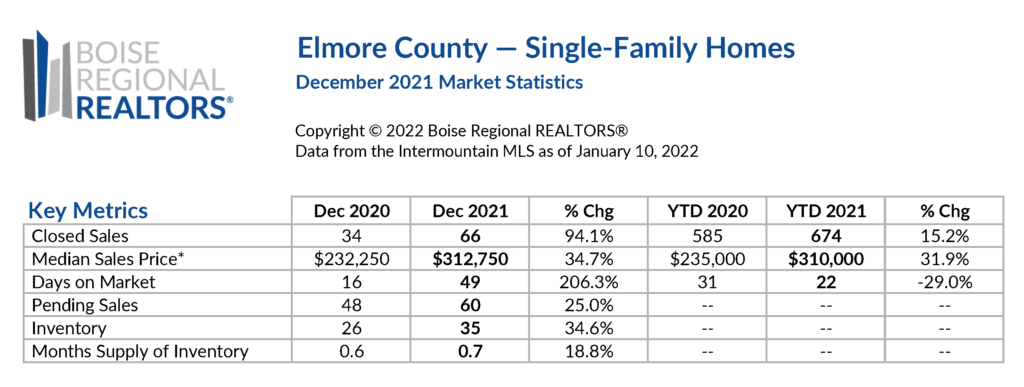
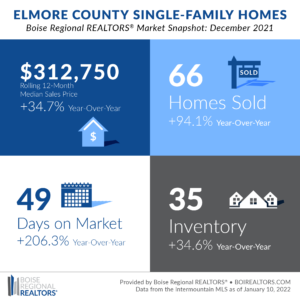
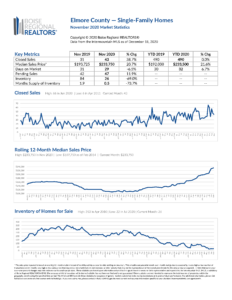
There were 674 homes sold in Elmore County in 2021, an increase of 15.2% compared to 2020 annual sales. Of those, 605 were existing sales while 69 were new construction.
The Days on Market (DOM) metric reached a low of six days in June 2021, but since then, market times have increased and normalized, reaching an average of 49 days in December 2021. This was 33 days longer than in December 2020, and more in line with pre-pandemic levels from early 2020.
The overall median sales price for the county in 2021 reached $310,000, up 31.9% from 2020 and the largest annual gain since we began tracking this data in 2006. Prices continued to be driven by insufficient supply compared to buyer demand.
When looking at prices by segment, the median sales price for existing homes was $305,000 year-to-date, a 37.1% increase year-over-year. For new homes, the year-to-date median sales price came in at $382,990, a 34.2% increase compared to 2020. New homes typically sell at higher price points, due to increased costs of land, labor, and construction materials.
The last few months of 2021 brought more normal market times and increases in inventory, which were both good signs for buyers. However, with just 0.7 Months Supply Inventory in December, we’re still a long way from a balanced market and hope homeowners are able to realize the great values for their properties by listing in the coming months.
Whether you’re looking to buy or sell, it’s never been more important to work with a REALTOR®. They will help identify potential options for purchase, connect you with a mortgage lender, help craft a competitive offer, and negotiate on your behalf, allowing you to make decisions confidently and quickly to achieve your real estate goals.
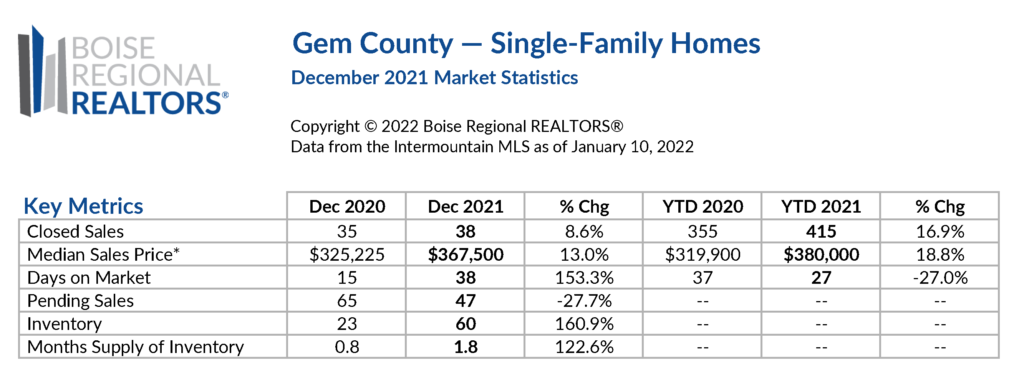
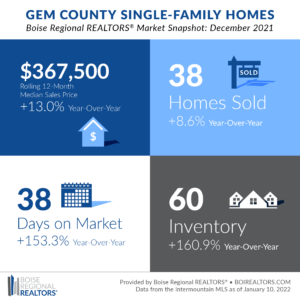
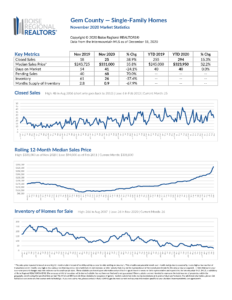
There were 415 homes sold in Gem County in 2021, an increase of 16.9% compared to 2020. Of those, 313 were existing sales while 102 were new construction.
Insufficient supply compared to buyer demand drove the median sales price up, reaching $380,000 for 2021 and marking an 18.8% increase over the same period in 2020.
When looking at prices by segment, in particular new construction, the median was slightly higher, reaching $385,214 in 2021, a 14.4% increase compared to 2020. The median sales price for existing homes matched the overall market at $380,000.
New construction activity has really picked up in Gem County over the last seven months. Unlike Ada County, we didn’t see a large price difference between existing versus new homes in Gem County. The difference is due to costs of land, labor, and materials for new construction, but for many buyers, the appeal of large lots tied to existing properties carried a premium. In 2021, new homes sold in Gem County had an average of 0.3 acres, while existing home sales had an average of 3.7 acres.
The last few months of 2021 brought more normal market times and increases in inventory, which were both good signs for buyers. That said, with only 1.8 Months Supply Inventory in December, we haven’t reached a balanced market and we hope more homeowners are able to realize the great values for their properties by listing in the coming months.
Whether you’re looking to buy or sell, it’s never been more important to work with a REALTOR®. They will help identify potential options for purchase, connect you with a mortgage lender, help craft a competitive offer, and negotiate on your behalf, allowing you to make decisions confidently and quickly to achieve your real estate goals.
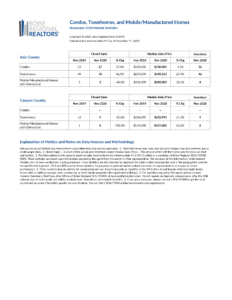
Additional information about trends within the Boise Region, by price point, by existing and new construction, and by neighborhood, are now available here: Ada County, Elmore County, Gem County, City Statistics, and Condos, Townhouses, and Mobile/Manufactured Homes Market Reports. Each includes an explanation of the metrics and notes on data sources and methodology.
Download the latest (print quality) market snapshot graphics for Ada County, Ada County Existing/Resale, Ada County New Construction, Elmore County, and Gem County. Since Canyon County is not part of BRR’s jurisdiction, we don’t publicly report on Canyon County market trends. Members can access Canyon County snapshots and reports in the Market Report email, or login to our Market Statistics page. Boise and Owyhee County snapshots can also be accessed on our Market Statistics page.
# # #
The data reported is based primarily on the public statistics provided by the Intermountain MLS (IMLS), a subsidiary of Boise Regional REALTORS® (BRR). These statistics are based upon information secured by the agent from the owner or their representative. The accuracy of this information, while deemed reliable, has not been verified and is not guaranteed. These statistics are not intended to represent the total number of properties sold in the counties or cities during the specified time period. The IMLS and BRR provide these statistics for purposes of general market analysis but make no representations as to past or future performance. If you have questions about this report, please contact Pete Clark, Director of Communications for Boise Regional REALTORS®. For notes on data sources, methodology, and explanation of metrics, visit boirealtors.com/notes-on-data-sources-and-methodology.
If you are a consumer, please contact a REALTOR® to get the most current and accurate information specific to your situation. For those seeking information on mortgage and rental assistance, including down payment programs, visit the Resources for Property Owners and Renters sections of BRR’s website.
Boise Regional REALTORS® (BRR), a 501(c)(6) trade association, represents real estate professionals throughout the Boise region. Established in 1920, BRR is the largest local REALTOR® association in the state of Idaho, helping members achieve real estate success through ethics, professionalism, and connections. BRR has two wholly-owned subsidiaries, Intermountain MLS (IMLS) and the REALTORS® Community Foundation.
“REALTOR®” is a federally registered collective membership mark which identifies a real estate professional who is member of the National Association of REALTORS® (NAR) and subscribes to its strict Code of Ethics.

