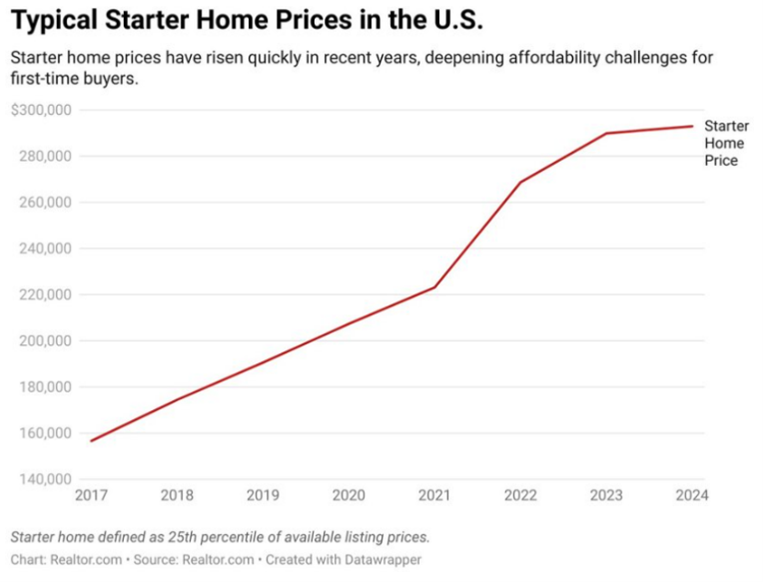
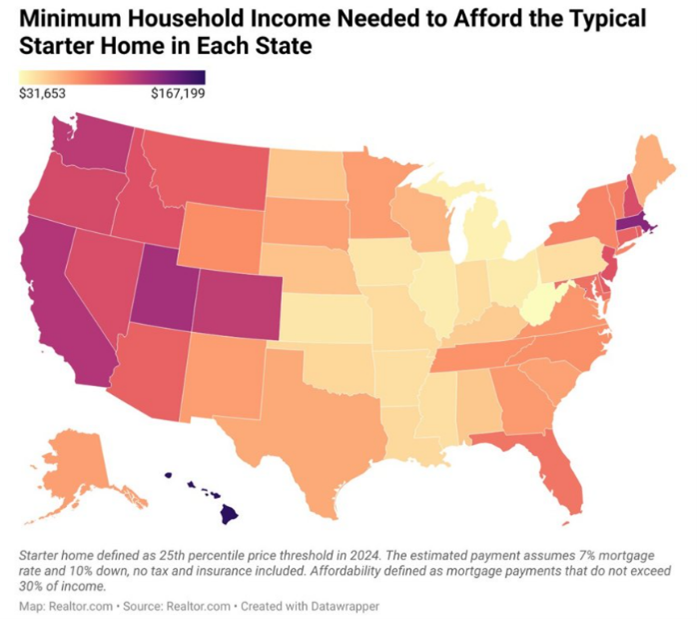
Mortgage rates ended the year just below 7%. Nationally, it means the household income now required to purchase the typical starter home is $70,164, up more than 100% from the $32,357 required in 2019 (Starter home is defined as a home with an available list price in the 25th percentile of all homes available). This decrease in affordability is caused by increasing incomes being unable to keep up with increasing home prices:
-
-
- Typical incomes have risen 17% from 2019 to 2023 (without adjusting for inflation)
- Starter home prices have increased nationally from $190,559 in 2019 to $292,950 in 2024
-
In addition, mortgage rates were below 4% for the majority of 2019 which helped significantly with affordability.
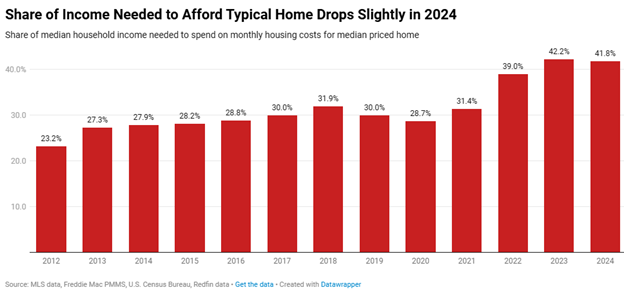
People in the United States have long followed the financial guideline that no more than 30% of monthly income should be spent on housing. In 2024, housing affordability remained at levels seen in 2023 which were the worst seen in the past decade. In 2024, a household earning the median U.S. income would have to spend 41.8% of their earnings on monthly housing costs to afford the median priced U.S. home. This is assuming the average 2024 mortgage rate of 6.72% and a 15% down payment.
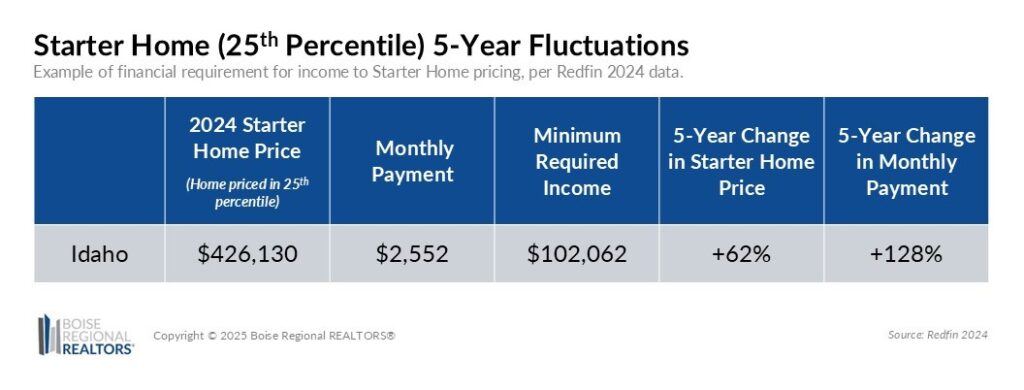
To keep mortgage payments within 30% of income, the table below shows what an Idahoan would have needed to earn in order to afford a starter home in 2024. The increase in starter prices and monthly payments have driven up the income required to afford these homes without dedicating more than 30% of monthly income towards housing costs. This may contribute to individuals being reluctant to purchase these homes or households putting themselves in more hazardous financial situations in order to purchase a home in 2025.
In 2024 we saw some decline in existing home inventory which may indicate the reluctance of individuals to sell their homes due to increasing prices and mortgage rates. This is keeping many would-be sellers “locked in” and could continue to hinder total inventory recovery. Of outstanding mortgages, 83% are still below a 6% rate and 21.3% are below a 3% rate. We will continue to monitor inflation and interest rates in the new year to see if this results in any inventory changes among existing homes.
Idaho’s population continued its positive trend in 2024 and surpassed 2 million residents according to new estimates released by the U.S. Census Bureau on December 19th. Idaho’s population on July 1, 2024 was 2,001,619 people, an increase from 1,971,122 people in 2023. The total increase of 30,497 people gave Idaho a growth rate of 1.4% from 2023 to 2024 which ranked 7th among states nationally.
This same U.S. Census Bureau data release also showed Idaho leading the nation in median household income growth. The data release incorporated 5 years of data to make a more accurate estimate, the release on December 19th used data from 2019-2023. According to this data, median household income in Idaho grew $10,011 (15.5%) as compared to a national average of $5,144. In terms of percent growth, Idaho ranks first nationally for highest median household income growth rate.
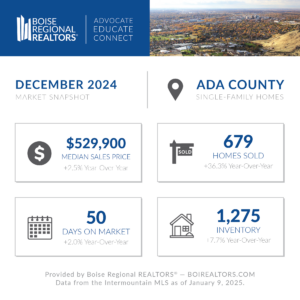
Ada:
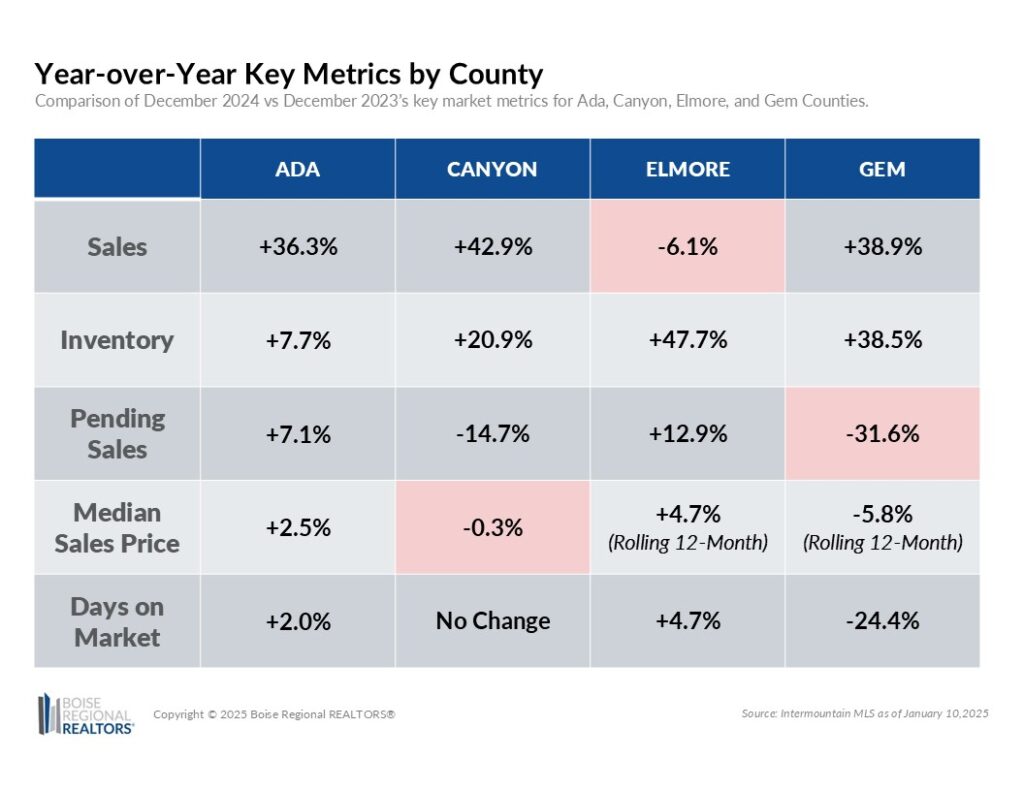
When compared to December 2023, Ada County still has considerably higher sales but inventory is beginning to inch closer to where it was in previous years. The number of homes in inventory remains above December 2023 but has been trending downward since September, particularly with resale homes. With interest rates expected to remain near 7% moving into 2025, we will wait to see if this will lead to further decline in resale inventory as sellers may be reluctant to voluntarily leave lower interest rates in pursuit of a new home.
Canyon:
Sales in Canyon remain well above where they were in December 2023, particularly for resale homes which were 62% higher December 2024 than in December 2023. Inventory for both new and resale homes declined from September 2024 to the end of the year and sales appear to be following. Canyon is undoubtedly at higher levels in terms of inventory and sales volume than it was at the end of 2023 but may be slowing down looking forward to 2024 as both inventory and sales have declined in recent months. This may indicate there is wavering demand for homes at this time.
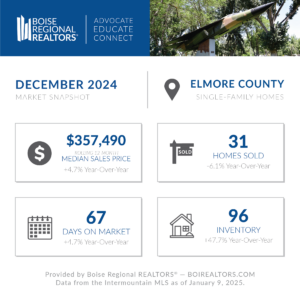
Elmore:
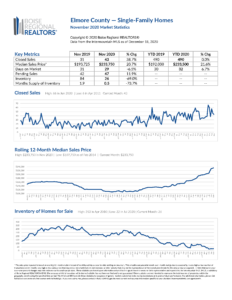
With the number of homes being sold in Elmore County around 30 per month, it is important to note the volatility that may be present in some metrics moving month to month. Currently inventory remains well above where it was in December 2023 but in recent months, like several other counties, resale home inventory has declined. New home inventory seems to be more stable looking toward January 2025. It is the sales of these new homes in inventory that we will look at moving forward since the lack of them in December is what is currently driving the number of homes sold down in Elmore.
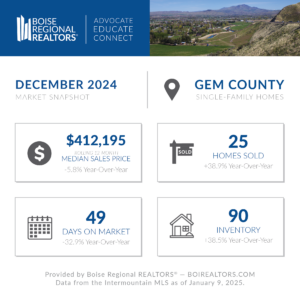
Gem:
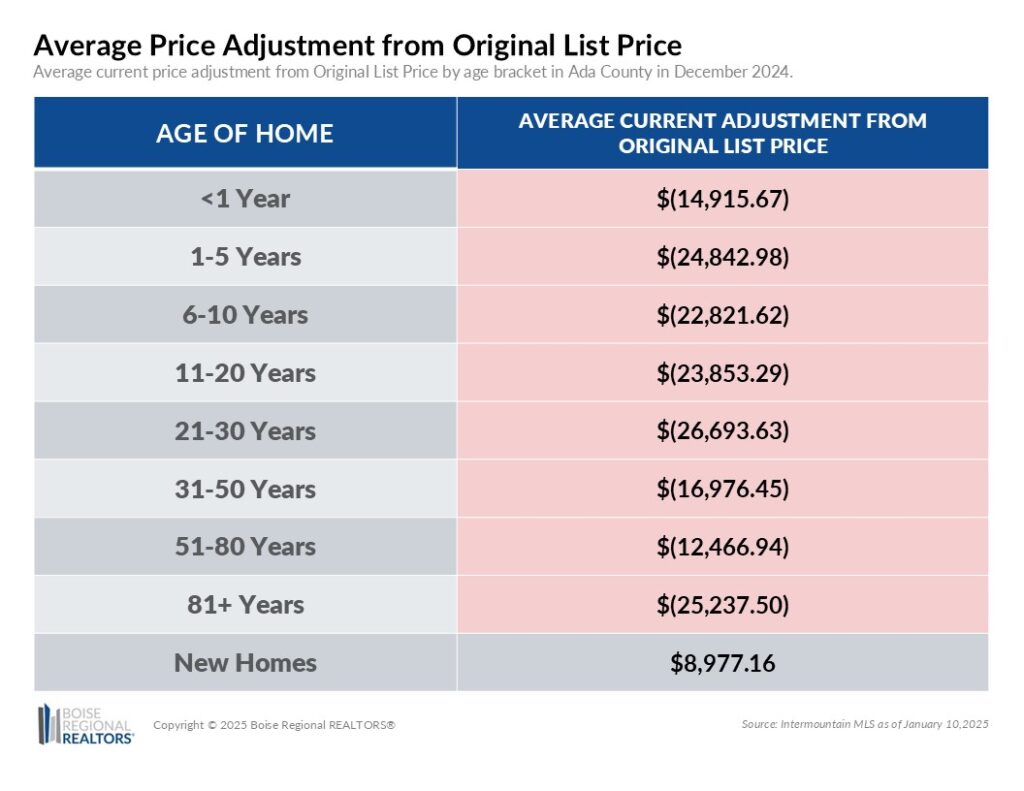
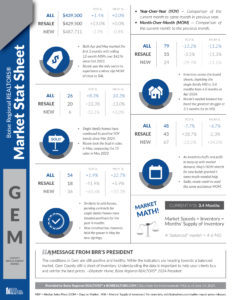
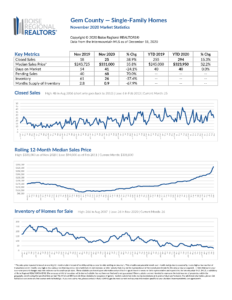
Like other counties, volume in terms of sales and home inventory in Gem County is well above where it was in December 2023. Moving into 2025, customers appear to be more sensitive to prices and sellers have needed to drop prices in recent months in order to sell. This may be a reason for the lower number of pending sales currently seen in Gem County. The lower number of pending sales was driven by new homes which are currently priced higher than existing homes. This may be an indication of reduced buyer willingness to lock in these comparatively higher prices while interest rates remain high.
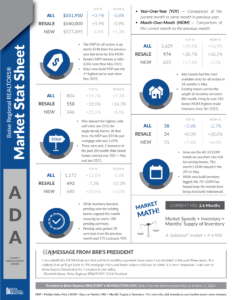
Median Sales Price remained at levels seen in November (+0.9%).
-
-
- Median sales price for existing homes dipped slightly while a slight increase was seen for new homes. The median sales price for new homes is around 15K higher than existing homes sold in December.
- A nearly constant number of resale homes aged 21-50 years old were sold in November and December (181 vs. 182) but the prices of ones sold in December were lower. The median sales price of these homes in December was 10K less than similar aged homes sold in November.
- The median sales price of new homes was driven up slightly due to 9.7% of new homes having a sales price at or above $1 million compared to 7% of new homes sold in November.
-
The number of homes sold increased slightly (2.9%) in December.
-
-
- The number of existing homes sold in December declined for the second straight month while the number of new homes sold increased. In December, 42% of homes sold were new homes while in November only 36% of homes sold were new.
- These additional newly built, never occupied homes sold in December were located in Meridian with an MSP of $525K and Eagle with an MSP of $898K.
-
Pending Sales decreased for the third straight month and now sits only 7% higher than December 2023.
-
-
- 64% of all pending sales are new homes, indicating a different age composition of homes sold may occur in January 2025. Of these new homes pending sale, 64% are currently under construction and were on the market on average under 15 days.
- Pending existing home sales on average have a lower current price than the original listing price, this trend is not true for all new homes that are pending sale.
-
Inventory decreased for the fourth straight month; a 16.5% decrease was observed in December.
-
-
- Inventory of existing homes continues to decrease at a faster rate than inventory of new homes (28.7% drop compared to 4.5%). Currently, 57% of all homes in inventory are new homes.
- All homes in inventory have been on the market for an average of 90 days.
- Only 37% of single-family homes in inventory are priced at or below the MSP seen in December. We will wait to see if these homes experience price reductions or if these homes remain in inventory in January 2025.
-
Days on market increased by 8 days after remaining flat the previous 3 months.
-
-
- This metric was pushed up due to a 13-day increase seen with new homes in December. The increase in average days on market was seen with homes sold that were under construction in December. If two outlier homes are removed from the group (one that was on the market for 291 days and one on the market for 195 days) the average returns to a value similar to previous months.
-
Other Real Estate News
- HousingWire | Securing Customer Insurance in a Volatile Real Estate Market
- Yahoo! News | The Hottest Real Estate Market in 2025 Might Surprise You
- RisMedia | Inflation Up for the Third Straight Month, Though Economists See Silver Lining
Please note: Some news outlets may protect their content with paid subscriptions. While we try to refrain from sharing articles that may not be accessible to everyone, we may share them if important to the industry.
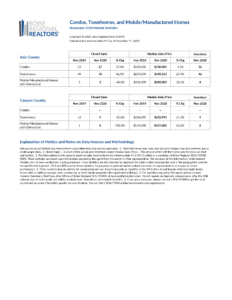
Additional information about trends within the Boise Region, by existing and new construction, are now available here: Ada County, Elmore County, Gem County, and Condos, Townhouses, and Mobile/Manufactured Homes Market Reports. Each includes an explanation of the metrics and notes on data sources and methodology.
Download the latest (print quality) market snapshot graphics for Ada County, Ada County Existing/Resale, Ada County New Construction, Elmore County, and Gem County. Since Canyon County is not part of BRR’s jurisdiction, we don’t publicly report on Canyon County market trends. Members can access Canyon County snapshots and reports in the Market Report email, or login to our Market Statistics page. Boise and Owyhee County snapshots can also be accessed on our Market Statistics page.
# # #
The data reported is based primarily on the public statistics provided by the Intermountain MLS (IMLS), a subsidiary of Boise Regional REALTORS® (BRR). These statistics are based upon information secured by the agent from the owner or their representative. The accuracy of this information, while deemed reliable, has not been verified and is not guaranteed. These statistics are not intended to represent the total number of properties sold in the counties or cities during the specified time period. The IMLS and BRR provide these statistics for purposes of general market analysis but make no representations as to past or future performance. If you have questions about this report, please contact BRR’s Director of Communications Taylor Gray at 208-947-7238. For notes on data sources, methodology, and explanation of metrics, visit boirealtors.com/notes-on-data-sources-and-methodology.
If you are a consumer, please contact a REALTOR® to get the most current and accurate information specific to your situation.
Boise Regional REALTORS® (BRR), a 501(c)(6) trade association, represents real estate professionals throughout the Boise region. Established in 1920, BRR is the largest local REALTOR® association in the state of Idaho, helping members achieve real estate success through ethics, professionalism, and connections. BRR has two wholly-owned subsidiaries, Intermountain MLS (IMLS) and the REALTORS® Community Foundation.
“REALTOR®” is a federally registered collective membership mark which identifies a real estate professional who is member of the National Association of REALTORS® (NAR) and subscribes to its strict Code of Ethics.

